
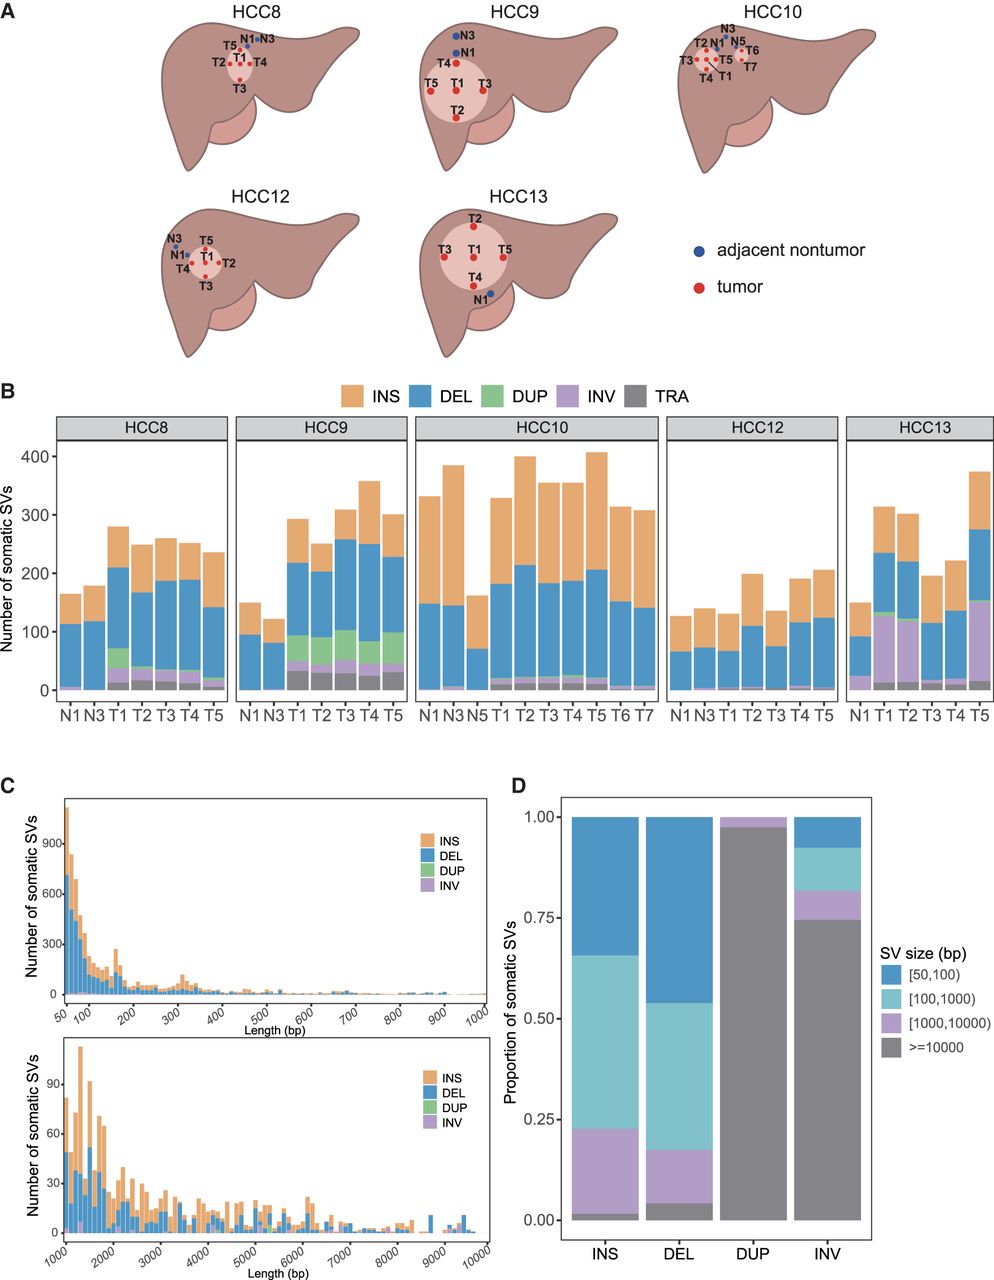
Figure 1.
Identification of somatic SVs through multiregion LRS. (A) Schematic diagram showing the sampling locations for five patients. Blue dots represent adjacent nontumor tissues. Red dots represent tumor tissues. (B) Bar plots depicting the number of somatic SVs across individual samples, including INSs, DELs, DUPs, INVs, and TRAs. (C) Stacked plots showing the distribution of somatic SV lengths are categorized into two ranges: (50 bp, 1 kb) and (1 kb, 10 kb), stratified based on SV types. (D) The proportion of different SV size ranges within each somatic SV type.


