
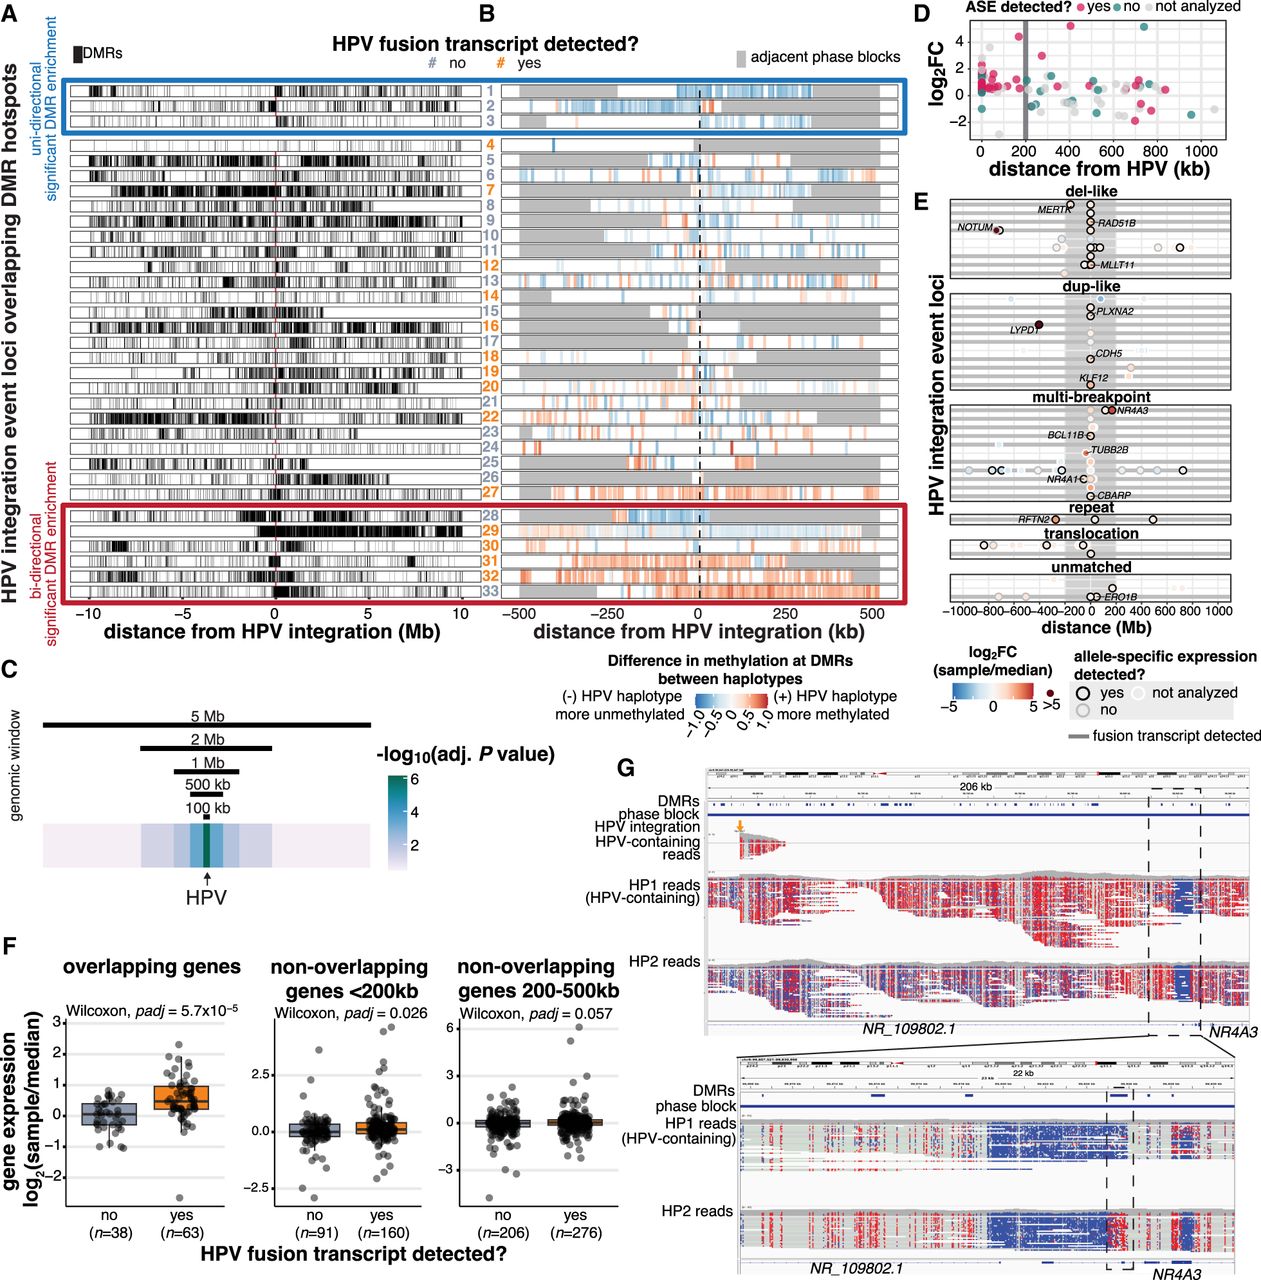
HPV integration is associated with dysregulation of the methylome and nearby genes on the integrated haplotype. (A) The distribution of DMRs across 10 Mb on either side of HPV integrations in the 33 events that overlapped a DMR hotspot. Each tick represents a DMR. Some event loci were situated <10 Mb from the end of the chromosome or from an unmappable region, resulting in a gap in DMRs before the end of the window (#7, 8, 12, 15, 19, 20, 23, 25, 26, and 29). (B) The direction of methylation changes in the HPV-containing haplotype with respect to the unintegrated haplotype within the phase block containing HPV integration. Adjacent phase blocks are shown as flanking gray bars. Events are ordered identically in A and B. The color of event numbers (center column) indicates the transcriptional status of the event. Events within the red (bottom) and blue (top) boxes show significant DMR enrichment (P adj < 0.05) either unidirectionally (blue box) or bidirectionally (red box) relative to the HPV integration event, as determined by a permutation test of the 500 kb bins flanking the event. (C) The significance of the association between HPV integration and high DMR density at all 147 HPV-integrated regions, using window sizes of 100,000 bp, 500,000 bp, 1,000,000 bp, 2,000,000 bp, and 5,000,000 bp around HPV. (D) The fold change and allele-specific expression (ASE) status of outlier genes (1.5 IQR below Q1 or 1.5 IQR above Q3) within 1 Mb of integration events. The log2 fold change (log2FC) of the integrated sample is relative to the median of the cohort. (E) The position of genes with outlier expression (1.5 IQR below Q1 or 1.5 IQR above Q3) relative to sites of HPV integration. Color indicates expression fold change in the integrated sample relative to the median of the cohort. The ASE status, integration event type, and transcriptional status of the event are also indicated. (F) The difference in gene expression fold change (integrated sample/median) at transcribed (yes) and nontranscribed (no) integration events. All box plots represent the median and upper and lower quartiles of the distribution; whiskers represent the limits of the distribution (1.5 IQR below Q1 or 1.5 IQR above Q3). Adjusted P-values in F were calculated using Benjamini–Hochberg-corrected Wilcoxon rank-sum tests. (G) Integrative Genomics Viewer snapshots showing wide (top) and zoomed (bottom) views of the haplotype-specific methylation changes around NR4A3 and HPV integration in HTMCP-03-06-02428 (#31), with reads separated into the two haplotypes (HP1 and HP2). The sample's DMRs, phase blocks, and HPV integration breakpoints are also indicated in the top three tracks. Reads are colored by CpG methylation status, with red indicating methylated and blue indicating unmethylated.


