
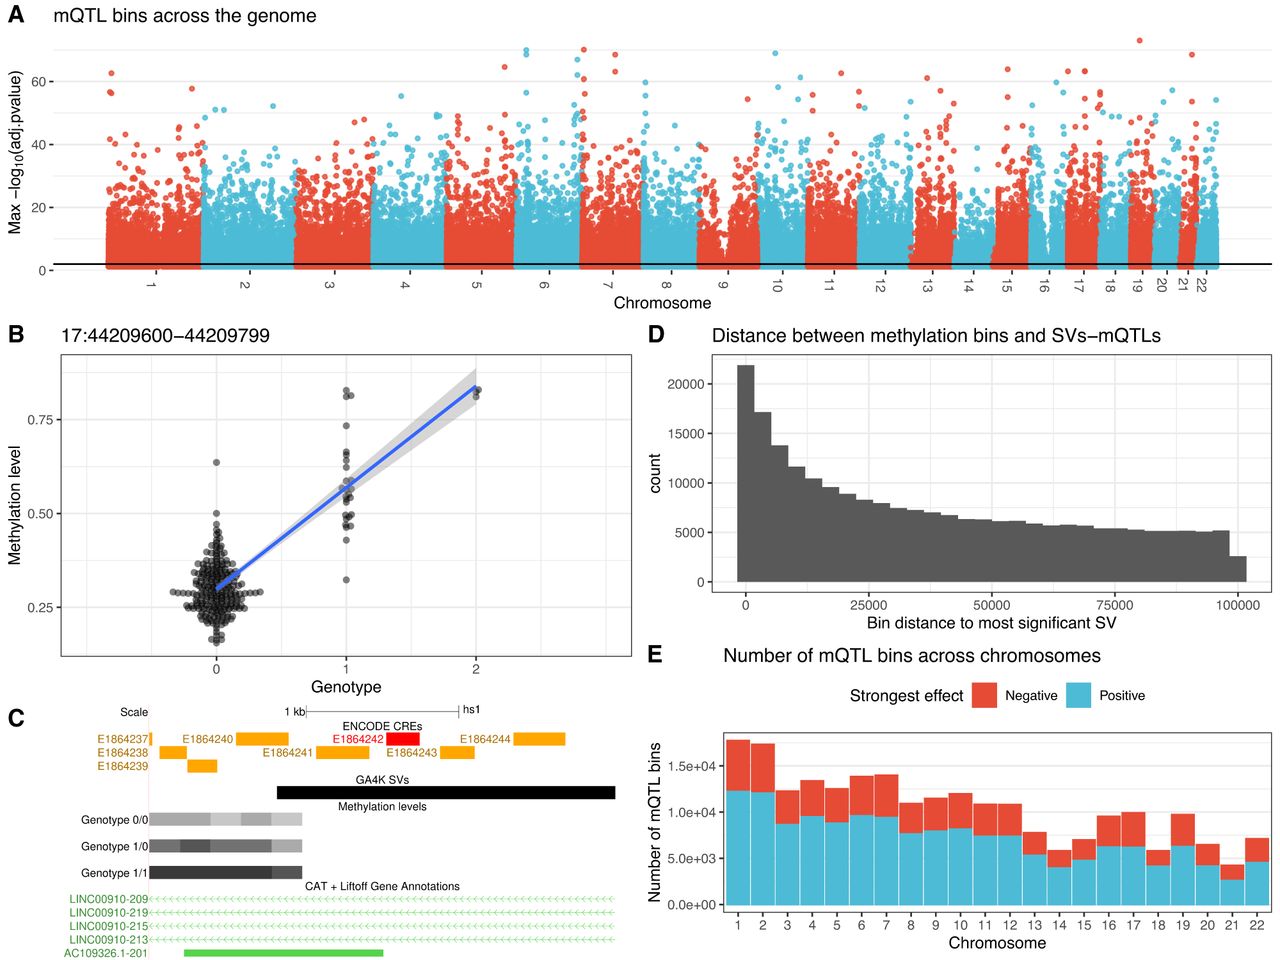
Quantitative trait locus mapping of 5mCpGs averaged in 200 bp methylation bins. (A) Manhattan plot of QTL methylation bins associated with an SV at FDR < 0.05 over the entire reference genome backbone. (B) Example of a leading SV-QTL interacting with nearby methylation levels. The nearest methylation bin is 34 bp away from the SV. (C) The SV allele (GA4K SVs track) is a 2216 bp deletion of CHM13v2.0#Chr17:44,210,434–44,212,650 and overlaps proximal enhancer-like signatures in ENCODE SCREEN (https://screen.encodeproject.org/). Also shown are the mean methylation levels (grayscale) of regions in QTL with the SV, stratified by SV genotype. (D) Distribution of distances between SV-mQTLs and their methylation bins. (E) Number of methylation bins in QTL with an SV in the GA4K pangenome across chromosomes, stratified by the positive and negative effect of the SV on methylation.


