
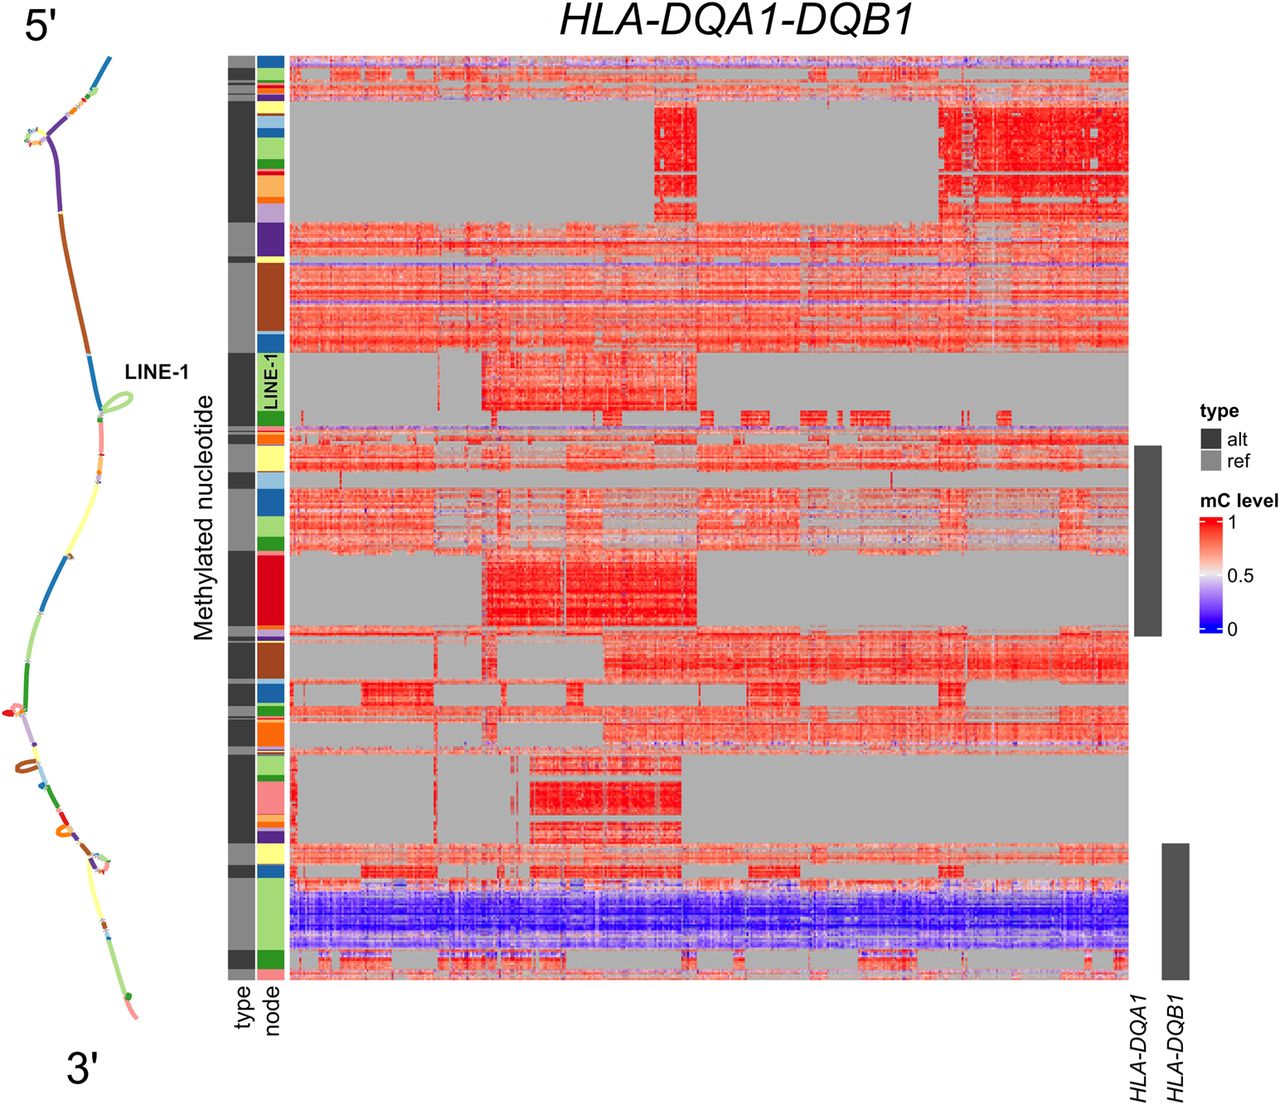
Heatmap visualization of methylation patterns of CpGs (rows) in the HLA-DQA1-DQB1 locus across 435 methylomes (columns) in the GA4K pangenome. CpGs are ordered top to bottom, in the 5′ to 3′ direction as they appear in a haplotype and on the corresponding subgraph on the left. CpGs are also annotated by the node in the graph (the node row annotation) and whether it is a reference or nonreference CpG (the type row annotation, alt or ref). The right annotation shows the genes that overlap the bubbles in which the CpGs lie. Light gray cells in the heatmap are CpGs that are not genotyped in that methylome. Also indicated is the location of the full LINE-1 insertion in the graph and on the heatmap.


