
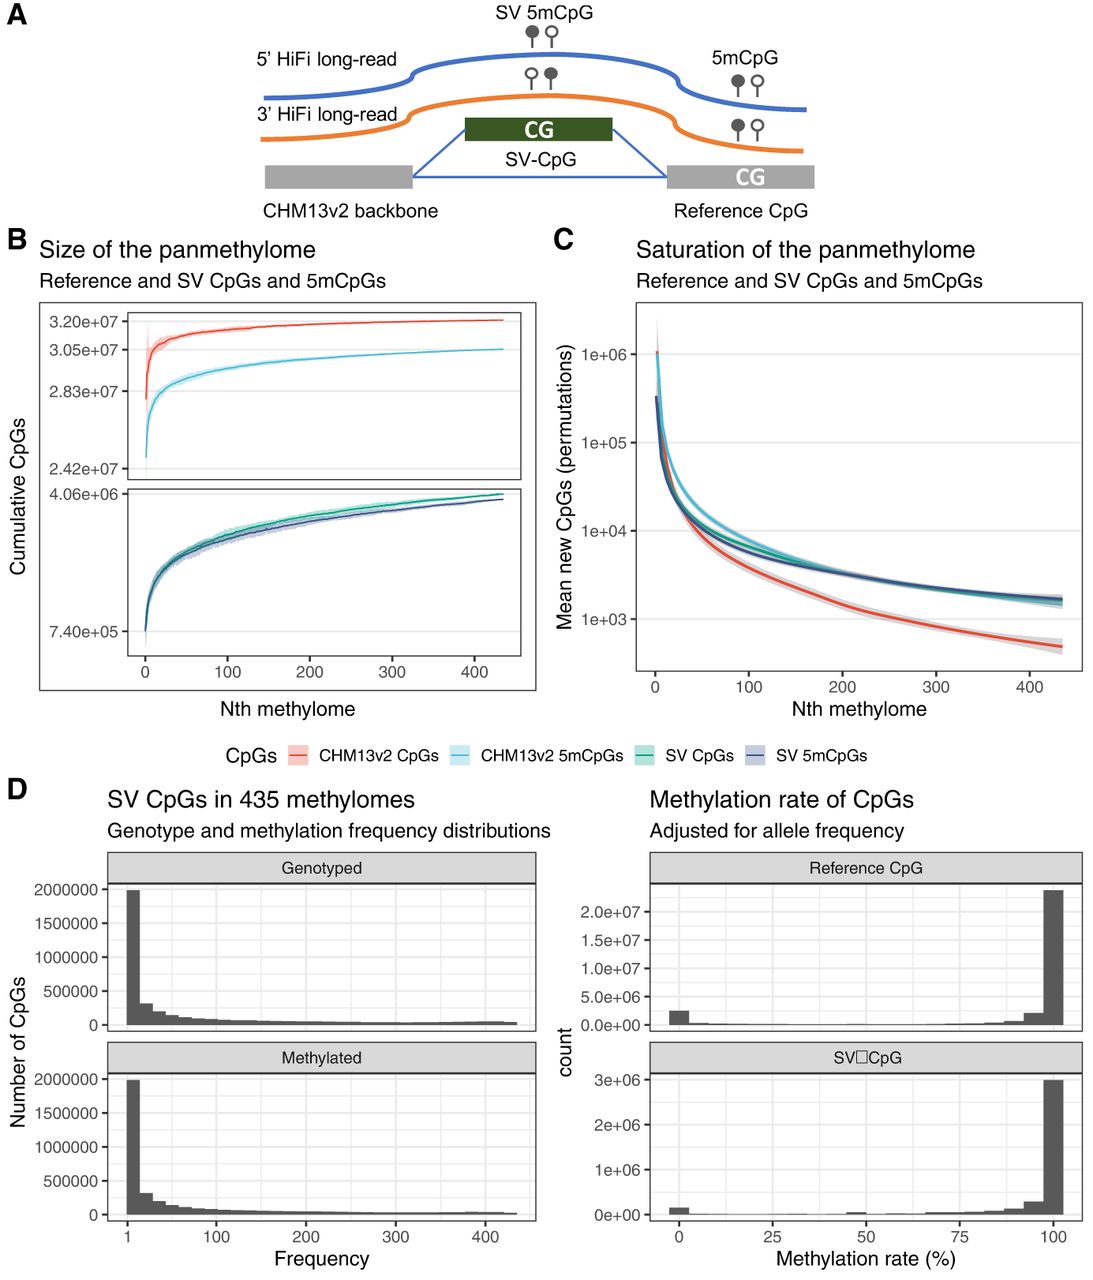
Illustration, number, frequency, and methylation of nonreference CpGs. (A) Illustration depicting the CHM13v2 backbone (gray) of the GA4K pangenome with a reference CpG, and an insertion (green) containing an SV-CpG that is not present in the reference. Also illustrated are HiFi long-reads featuring CpGs in a methylated state that align in this region to the positive and negative strand. (B) The cumulative number of reference CpGs, 5mCpGs, SV-CpGs, and SV-5mCpGs in the 435 methylomes. (C) The rate of change in the saturation of CpGs is shown in B. (D) Frequency distribution of SV-CpGs (red) and SV-5mCpGs (blue). (E) Observed methylation rates across SV- and reference CpGs, adjusted for allele frequency by counting only samples that carry any given CpG.


