
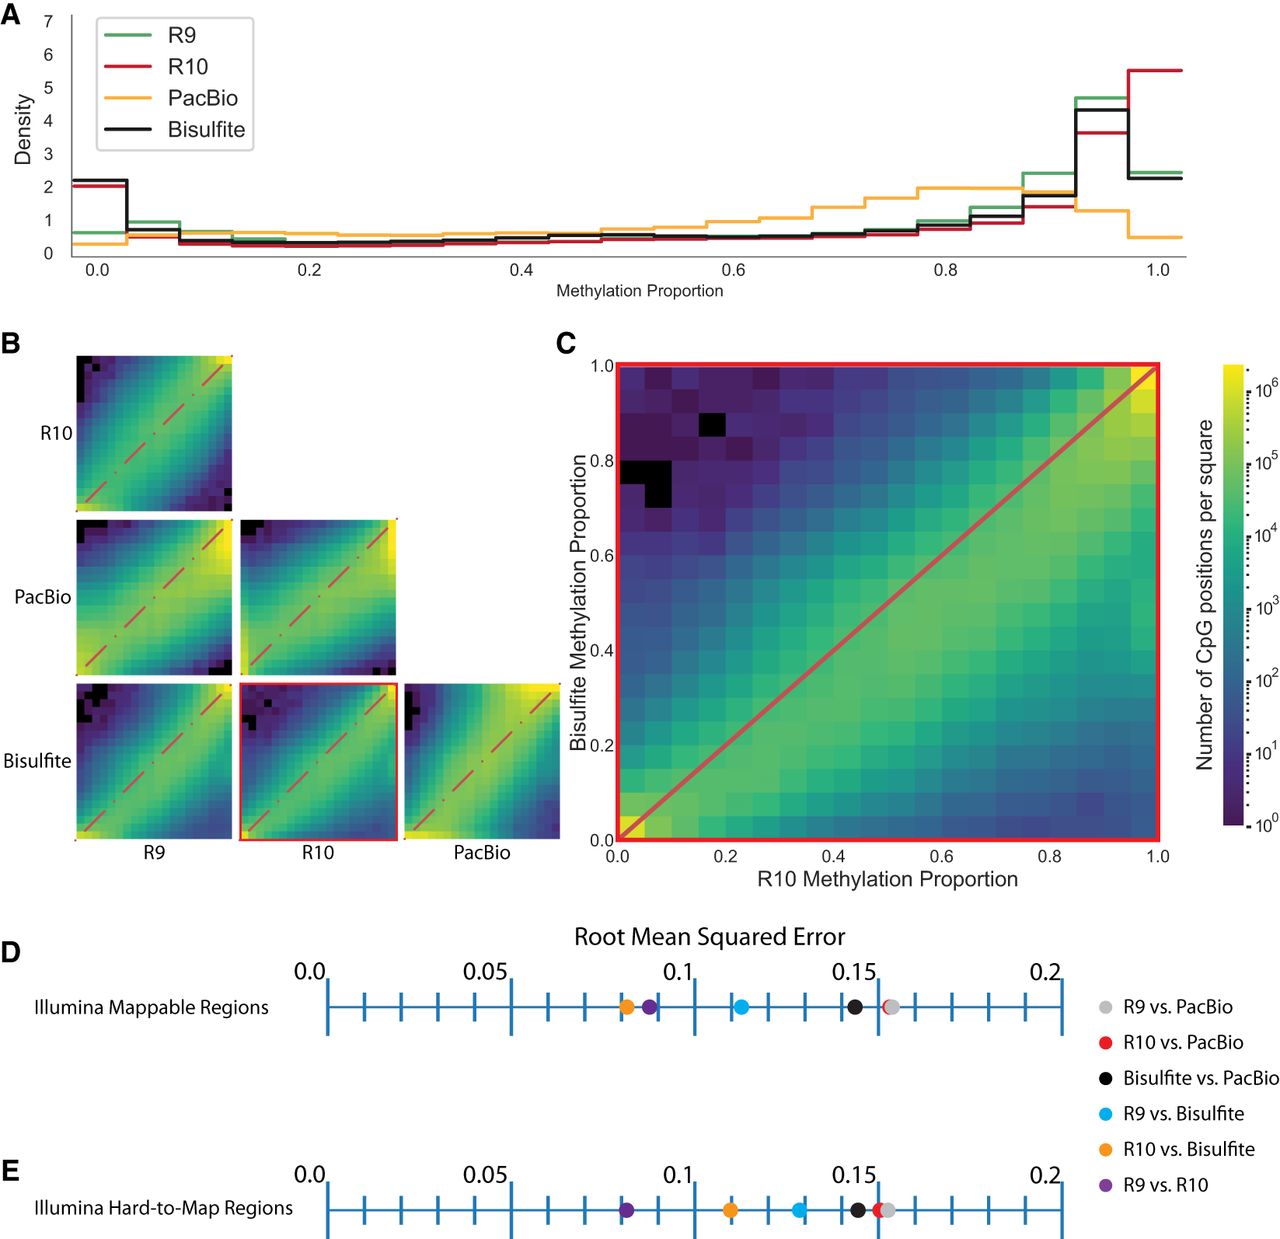
Figure 3.
Comparison of HG002 immortalized cell line methylation calling between technologies. (A) Methylation proportion histograms for each technology. (B) Pairwise site-specific CpG methylation proportion comparison between technologies. (C) Site-specific CpG methylation proportion comparison between R10 and bisulfite sequencing. (D) RMSE values for pairwise comparisons between technology in Illumina 150 bp paired-end mappable regions as defined by BisMap. (E) RMSE for pairwise comparisons between technologies in Illumina 150 bp paired-end hard-to-map regions.


