
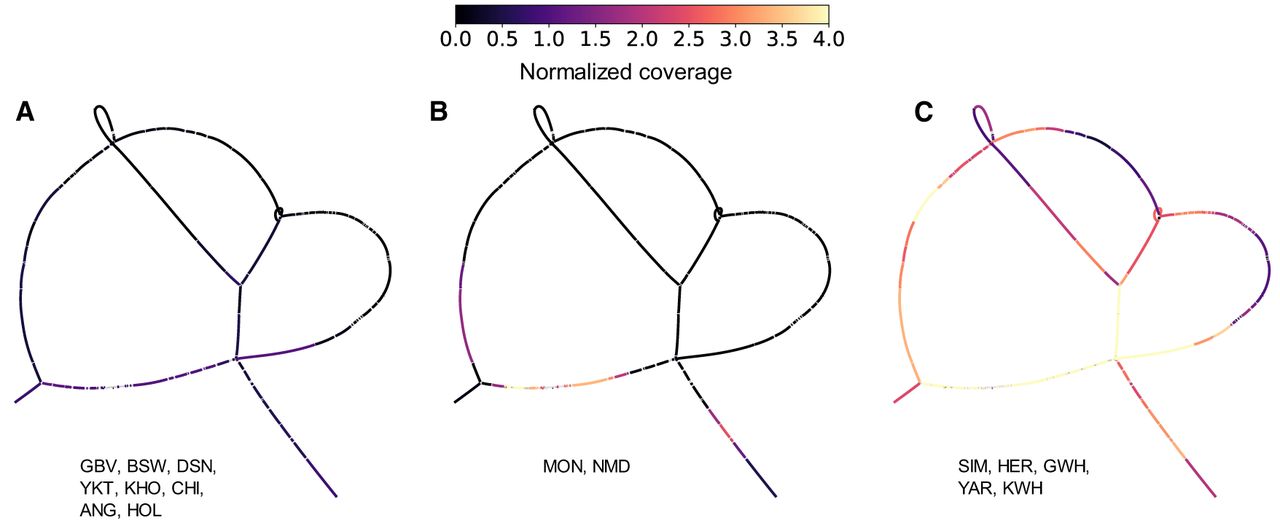
Figure 4.
Normalized graph coverage for the three observed coverage patterns. Coverage is averaged across all samples for each node for (A) GBV, BSW, DSN, YKT, KHO, CHI, ANG, and HOL, (B) MON and NMD, and (C) SIM, HER, GWH, YAR, and KWH. Lighter node colors indicate more aligned coverage to that node.


