
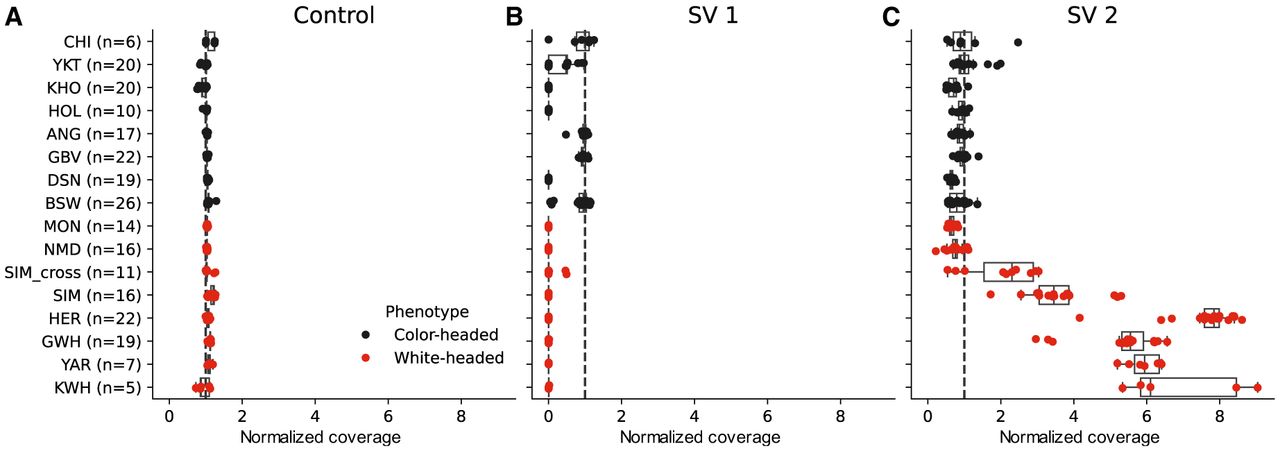
Figure 3.
Sequencing depth in short-read samples from 15 taurine breeds. (A) Normalized coverage (normalized over both sequencing depth and length of the region) per breed 1 Mb upstream of and downstream from the SV region. The dashed line indicates the expected normalized coverage of 1. (B) Similar to A, but for the smaller SV 1 region. (C) Similar to A, but for the larger SV 2 region.


