
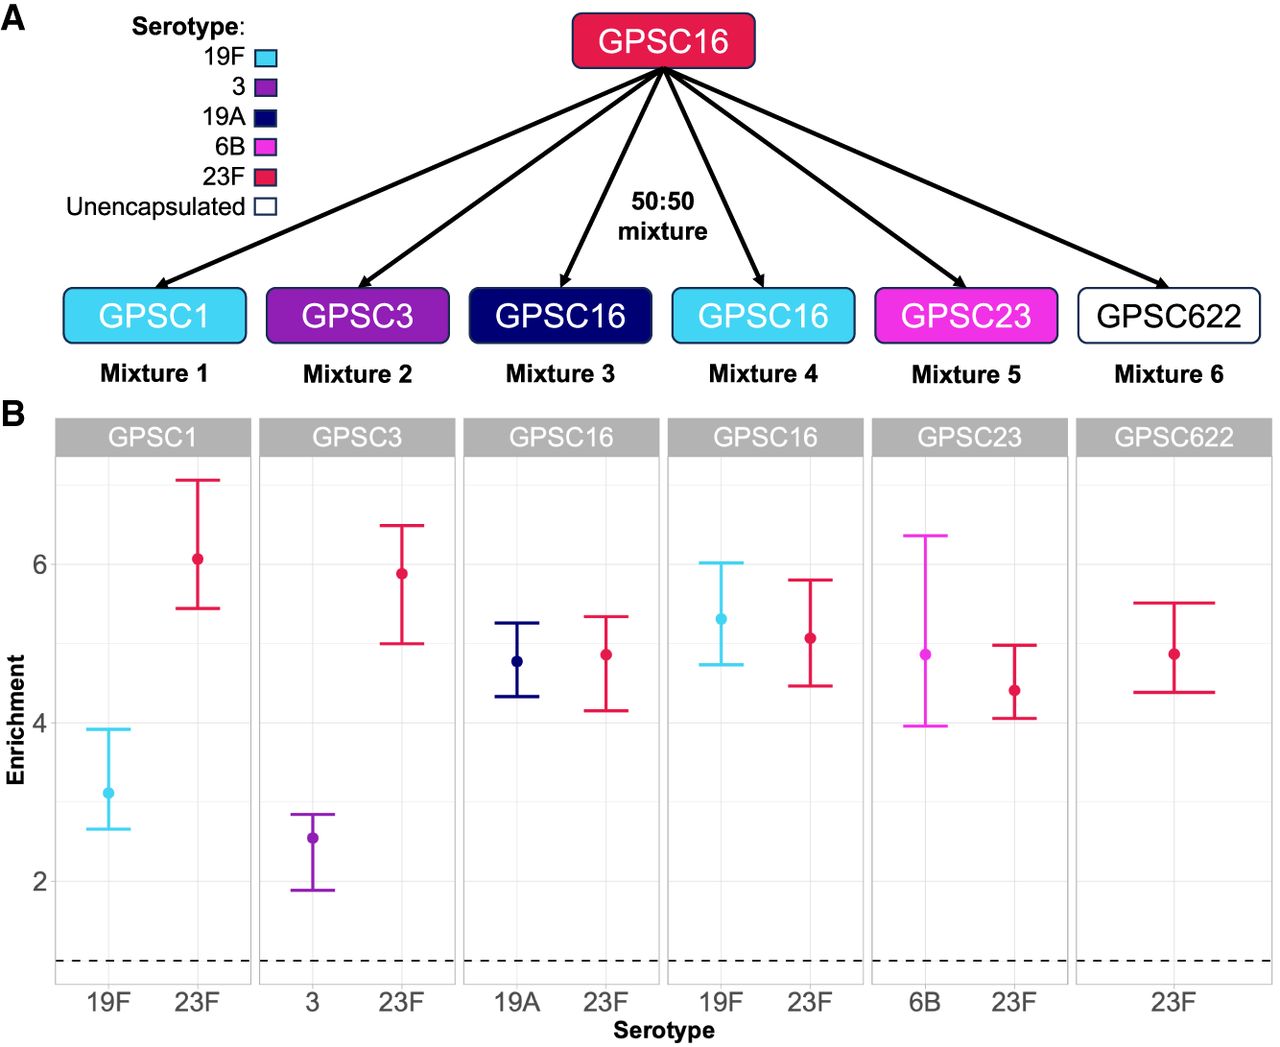
CBL enrichment in mixtures of multiple pneumococci. (A) Experimental setup. Spn23F DNA (GPSC16, serotype 23F, red) was mixed in 50:50 proportions with other S. pneumoniae isolates with different serotypes (given by color) and genotypes (given by global pneumococcal sequence cluster [GPSC]). (B) Enrichment of multiple CBL in mixtures. Bar ranges are interquartile range of enrichment from 100 bootstrap samples of reads. Data points are observed enrichment values for each CBL per library. x-axis and color describe the serotype combination of the S. pneumoniae isolate mixed with Spn23F; columns describe the GPSC. Dashed line describes enrichment = 1 (i.e., no enrichment has occurred). (GPSC) Global pneumococcal sequence cluster.


