
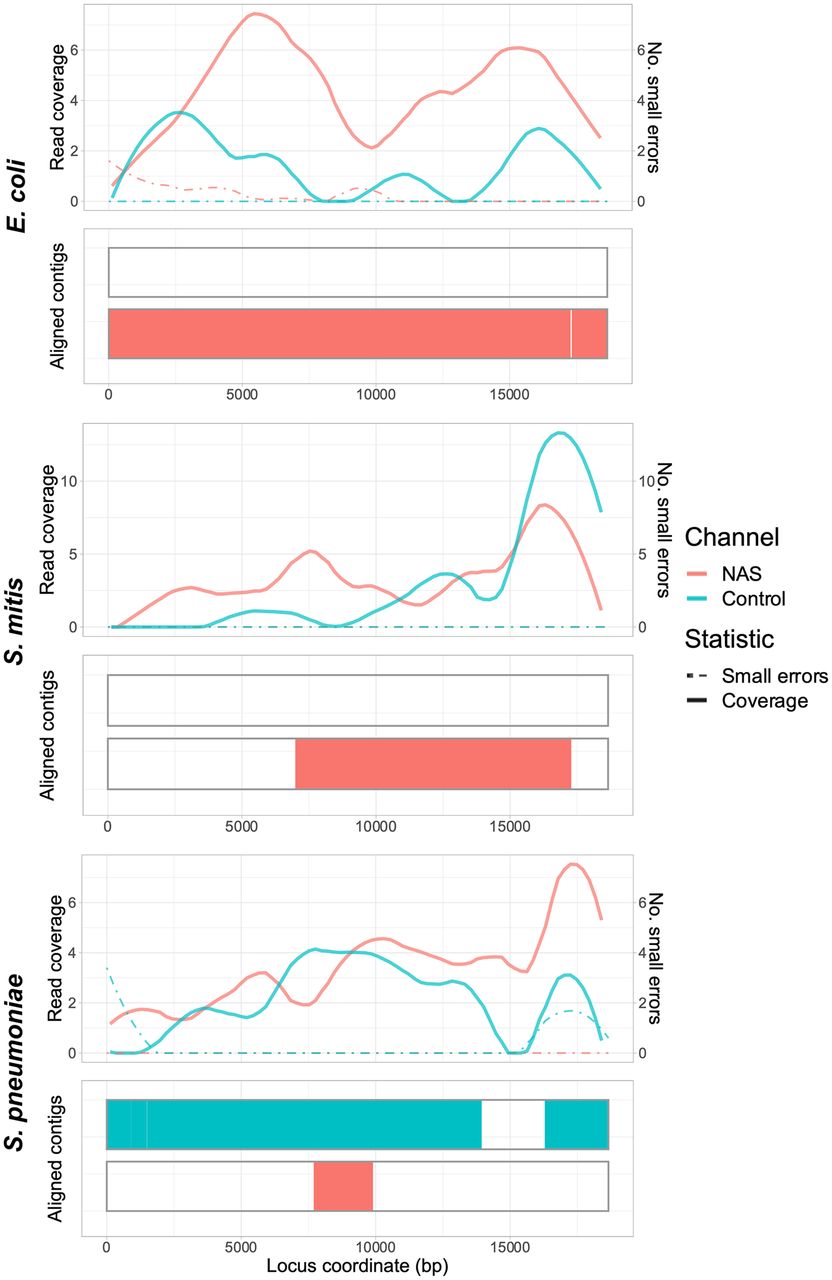
Figure 4.
Spn23F CBL enrichment assembly comparison. Each panel describes a 23F CBL assembly generated from 0.1 Spn23F dilutions (8 × 10⁻⁴ 23F CBL proportion) with each nontarget organism. For each panel, the top plot shows the read coverage (solid), defined as the absolute number of bases aligning to a locus, and the number of small errors (≤50 bp, dashed), and the bottom plot shows the aligned contigs (colors) and large errors (black bars >50 bp) in each assembly.


