
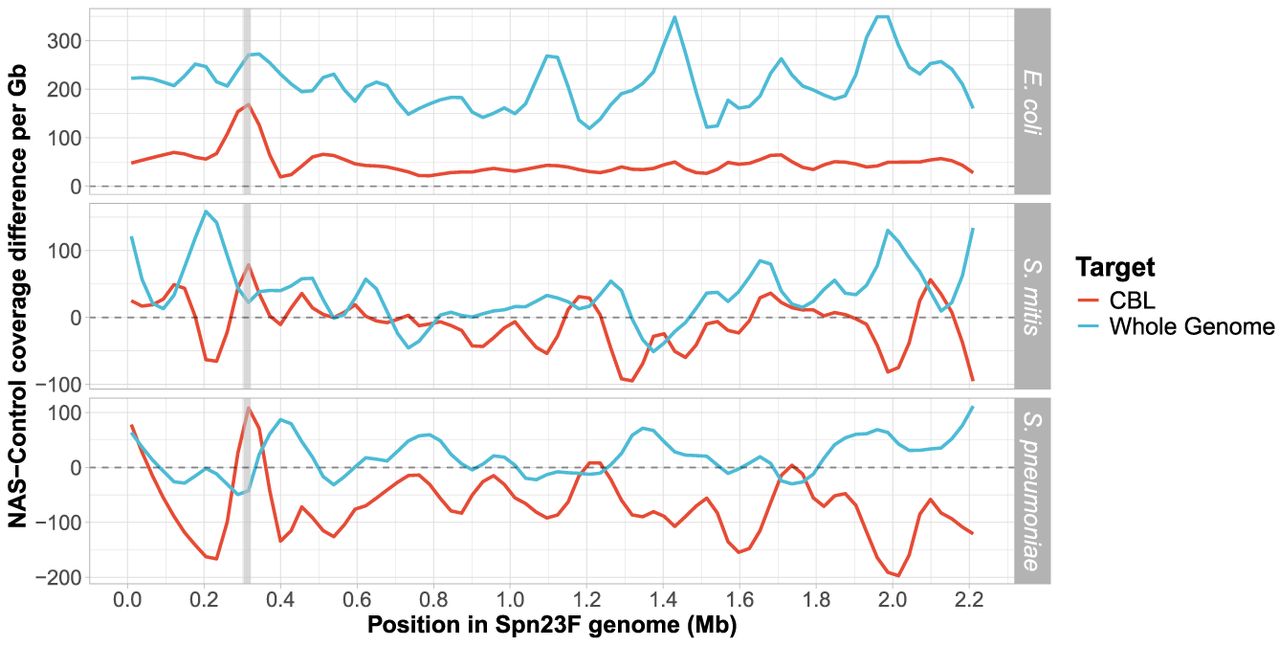
Difference in normalized coverage per locus between NAS and control channels across the Spn23F Chromosome when targeting whole genome (blue) or CBL (red) from 0.1 Spn23F dilutions with each nontarget organism. NAS-control coverage difference per gigabase (Gb) was calculated by normalizing the read coverage for each locus by the amount of data generated (in Gb) for each respective sample and channel, and then negating the normalized coverage for control channels from NAS channels for each locus. The gray dashed line at 0 indicates equivalent coverage at a given locus between NAS and control channels; >0 indicates NAS channels generated greater coverage, <0 indicates control channels generated greater coverage. Data are shown for 0.1 dilutions of Spn23F only. Gray column in each plot highlights the 23F CBL locus. Rows show different species for the nontarget, which was mixed with Spn23F in each sample.


