
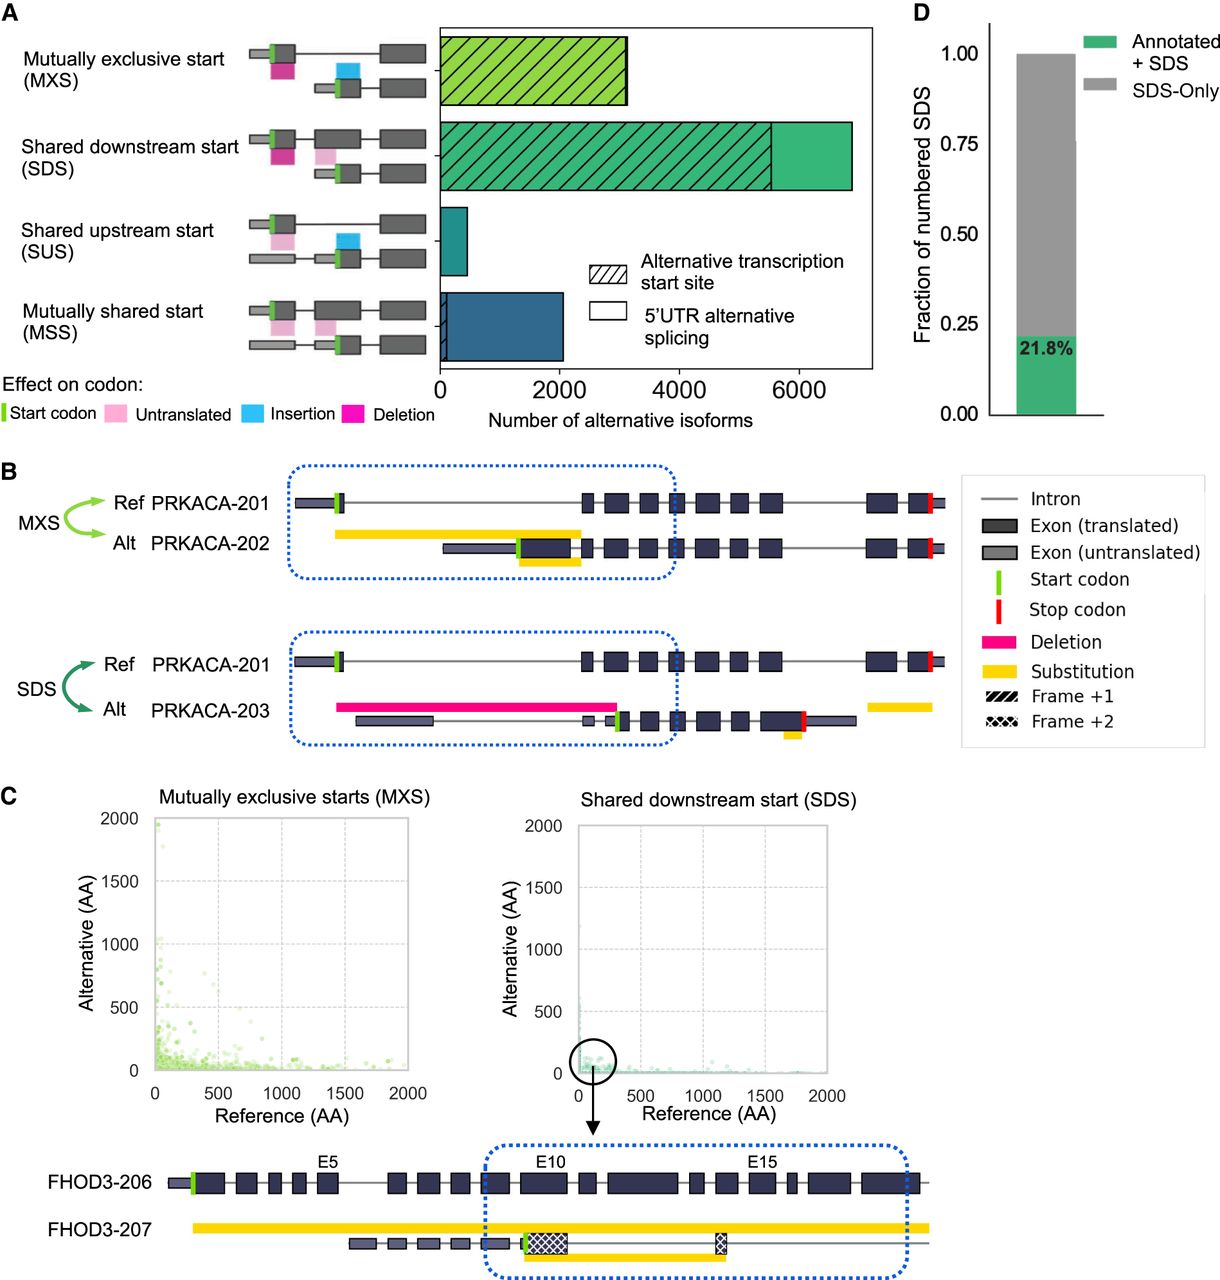
Analysis of mechanisms underlying variable N-terminal proteins across the GENCODE-annotated human proteome. (A) Distribution of the types of alternative N-terminal regions, classified based on the presence and translational status of the start codon. Hatches denote the fraction of alternative N-terminal regions associated with alternative TSSs, as opposed to 5′ UTR AS. (B) Biosurfer output of altered N-terminal regions for PRKACA gene that undergo MXS (light green arrows) and SDS (dark green arrows). In the example of MXS, the yellow bars above and below PRKACA-202 (alternate) transcript indicate the N-terminal ranges that differ between the reference and alternative isoform. The yellow bar above PRKACA-202 shows the N-terminal protein sequence that is specific to the reference (PRKACA-201) and the bar below the transcript indicates the N-terminal region specific to the alternative isoform. The Biosurfer bars span the intronic lines between exons, but intronic regions do not contribute to the protein sequence differences. In the example of SDS, the pink Biosurfer bar above the transcript of PRKACA-203 represents the range of transcript sequence that is translated in the reference, but not translated in the alternative isoform. (C) Scatterplot of the length of affected N-terminal variation in the reference versus alternative, faceted by mutually exclusive starts (MXS) or shared downstream start (SDS) status. An interesting case of an SDS leading to unique N-terminal sequence in the reference is caused by the usage of a different frame at the initiation of translation, with an example shown for isoforms of the gene FHOD3. (D) Fraction of SDSs caused by hybrid exon swaps.


