
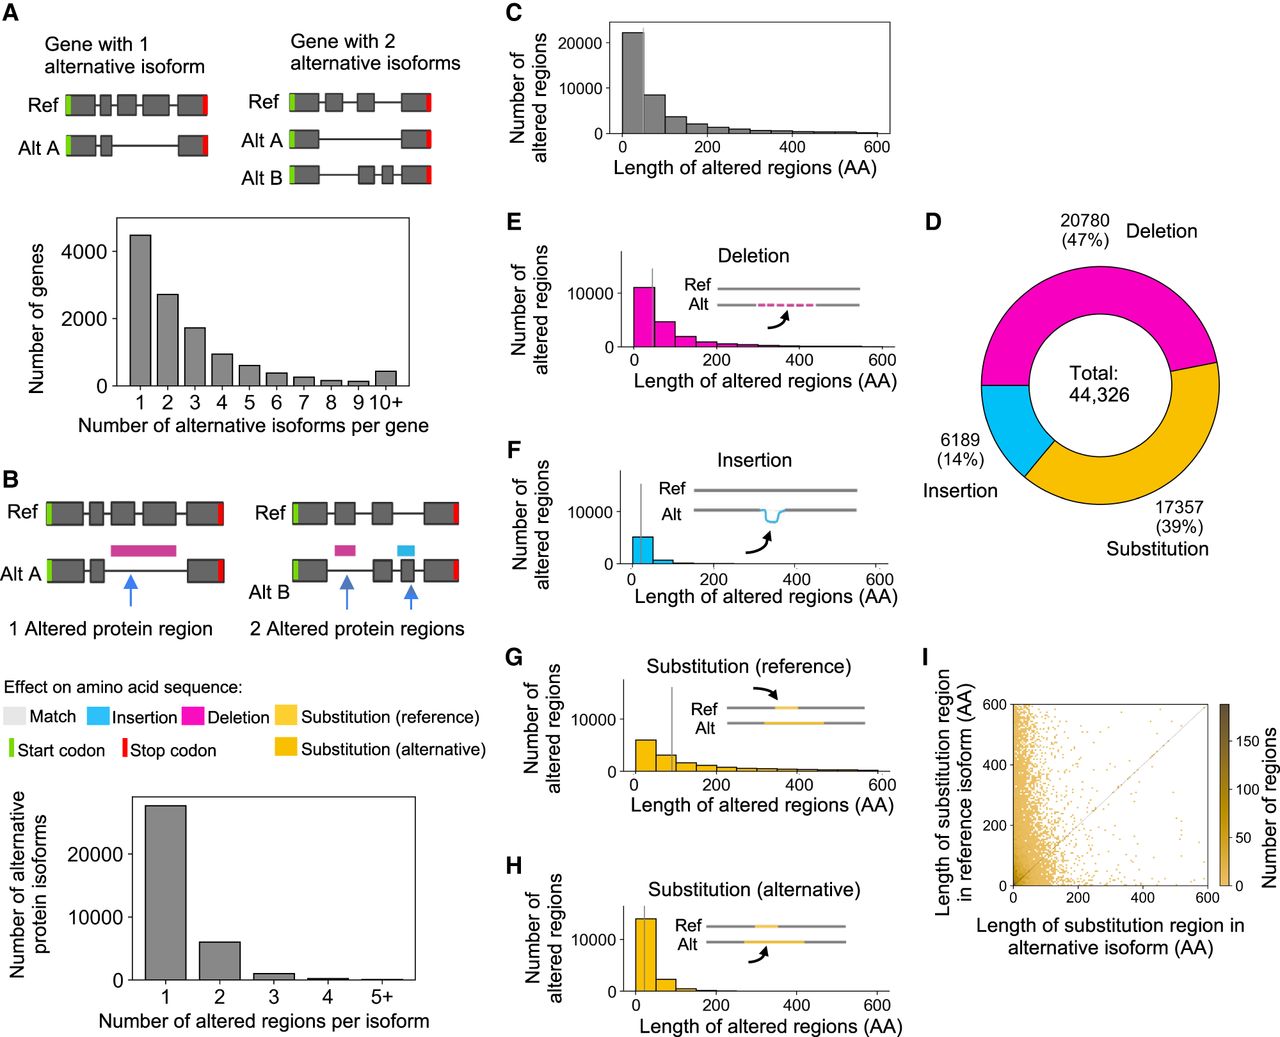
Characterization of altered protein regions (Biosurfer p-blocks) across the GENCODE-annotated human proteome. (A) Schematic of genes with one or two alternative protein isoforms and distribution of the number of alternative protein isoforms per gene. (B) Schematic of the altered protein regions (here, highlighted in pink and blue), displayed relative to the underlying transcript structures. The proteome-wide distribution of the number of affected protein regions observed per alternative isoform. (C) Distribution of the length of altered protein regions across the annotated proteome. Differences >600 AAs are not included (2347 cases, 5.3% of the data). These altered protein regions include cases of (1) deleted regions, (2) inserted regions, and (3) the region (in the reference isoform) in which one polypeptide subsegment is substituted for another. In other words, this distribution (C) represents an aggregation of the distributions shown in E–G. (D) Fraction of altered protein regions affected by insertions, deletions, and substitutions. (E–H) Distribution of the lengths of altered protein regions for (E) deletions, (F) insertions, (G) substituted region in the reference isoform, and (H) substituted region in the alternative isoform. (I) Comparison of the lengths of altered regions in the reference versus alternative isoforms for substitutions.


