
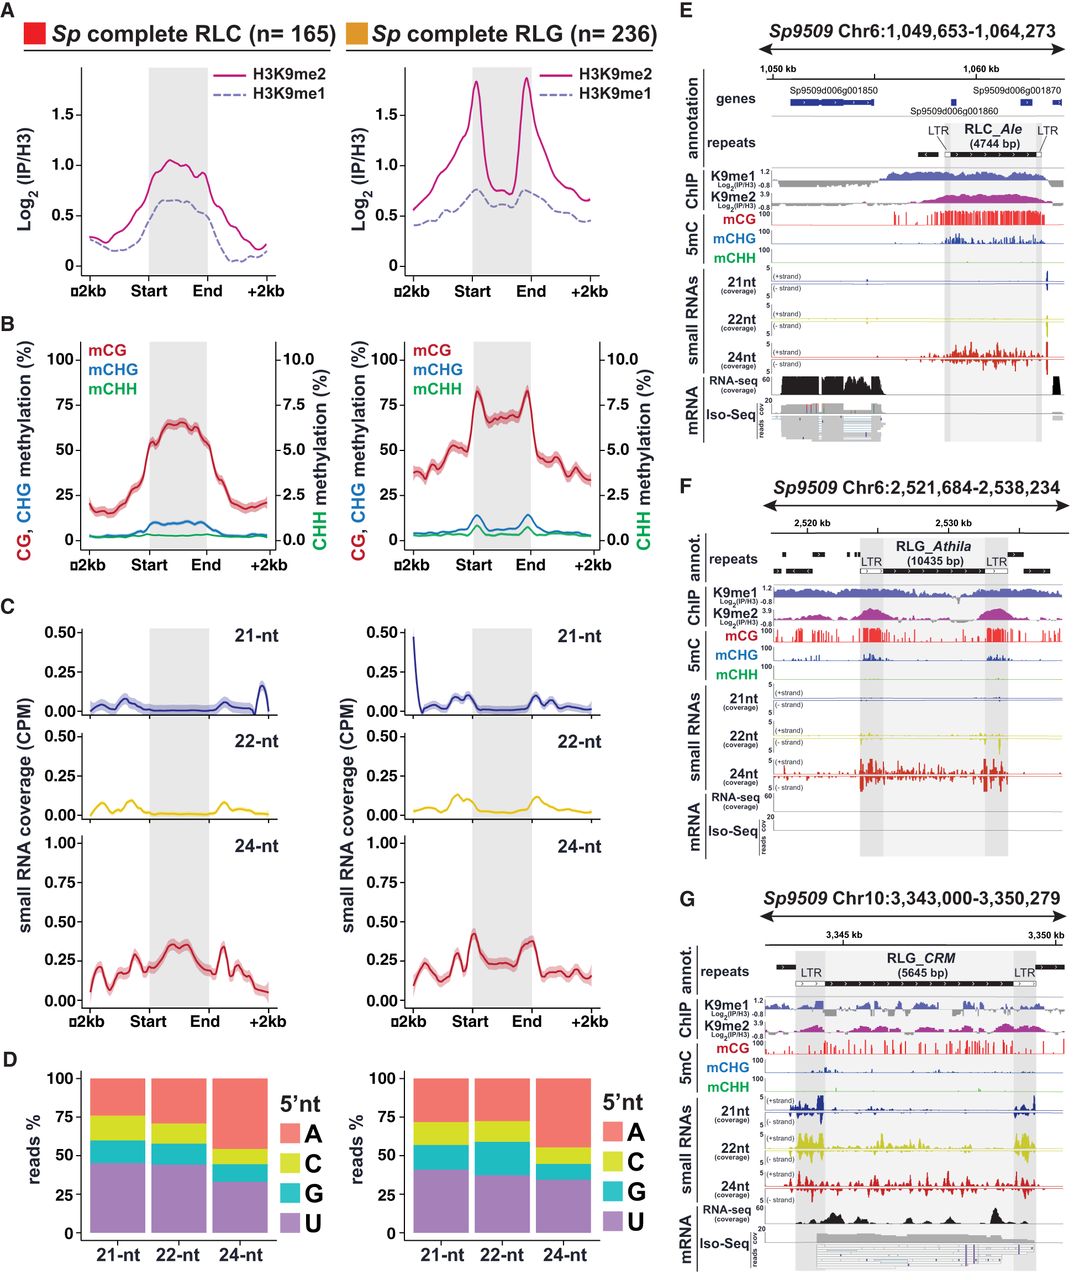
RdDM signatures in S. polyrhiza complete TEs. (A) Metaplots of average weighted H3K9me1 (solid line) and H3K9me2 (dashed line) enrichments over H3 at complete RLC (left) and RLG (right) transposon annotations ± 2 kb in Spirodela. Complete TEs were defined as those for which all RLC and RLG protein domains were identified. n indicates number of complete elements in each superfamily. (B) Metaplots of averaged weighted DNA methylation in all three contexts over RLC and RLG transposons ± 2 kb flanking regions in Spirodela. mCHH values are scaled to 10% max values instead of 100%. (C) Metaplots of averaged weighted 21, 22, and 24 nt sRNA abundance over intact RLC and RLG ± 2 kb flanking regions in Spirodela. In all metaplots (A–D), solid lines represent the mean, and colored shadows the SE. (D) 5′-Nucleotide (5′nt) composition distribution (as percentage of reads) of 21, 22, and 24 nt siRNAs mapping to intact RLC and RLG ± 2 kb flanking regions in Spirodela. (E–G) Genome browser captures of selected complete TEs in Spirodela. From top to bottom, tracks display gene and TE annotations; H3K9me1 and H3K9me2 enrichment profiles; mCG, mCHG, and mCHH methylation; 21, 22, and 24 nt siRNA mapping to Watson (+) and Crick (−) DNA strands; and RNA expression by short (Illumina) and long reads (Iso-Seq). Superfamily, clade, and length (in base pairs) of TEs is indicated above their annotation. Light and dark gray shadow delimit TEs and LTRs, respectively, across all tracks.


