
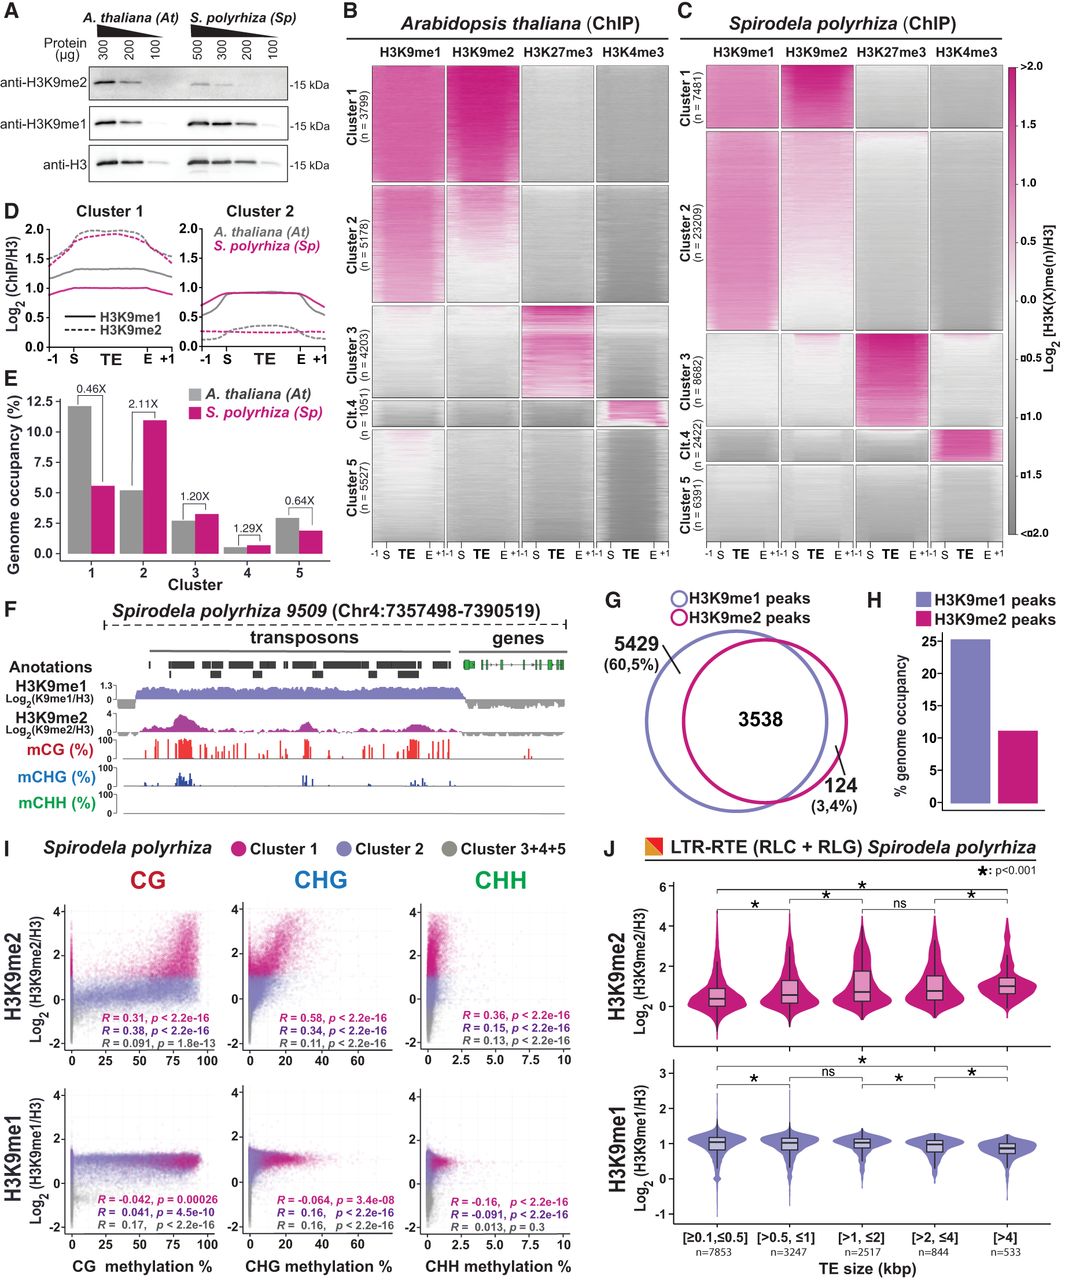
Patterns of H3K9me1/2 distribution in S. polyrhiza transposons. (A) Protein blot analysis of H3K9me1 and H3K9me2 abundance in Spirodela compared with Arabidopsis at different protein amounts (micrograms). Total H3 protein levels are shown as loading control. (B,C) Heatmap of k-means clustering of transposons in Arabidopsis (B) and Spirodela (C) using H3K9me1, H3K9me2, H3K27me3, and H3K4me3 enrichment over H3, presented as log2[ChIP(X)/ChIP(H3)]. Enrichment is represented by color, and depletion is shown in gray. Each row corresponds to a length-normalized TE annotation ± 1 kb. Transposons are grouped into clusters 1 to 5 based on the abundance of examined marks. (D) Metaplots of average weighted H3K9me1 (solid line) and H3K9me2 (dashed line) enrichments over H3 at cluster 1 and 2 transposons ± 1 kb in Arabidopsis (colored) and Spirodela (gray). (E) Relative genome (%) occupancy of each of the TE clusters defined in B and C in Arabidopsis (gray) and Spirodela (colored). (F) Genome browser capture of the distribution of H3K9me1 and H3K9me2 enrichments, together with DNA methylation, along genes and transposons in Spirodela. (G) Venn diagram of the overlap between H3K9me1 and H3K9me2 peaks along Spirodela genome. (H) Genome occupancy (%) of H3K9me1 and H3K9me2 in Spirodela genome. (I) Scatter plots of DNA methylation in all three contexts against H3K9me1 and H3K9me2 enrichments of TEs in cluster 1, 2, and 3+4+5 combined in Spirodela. R and P indicate Pearson correlation coefficients and P-values. (J) Analysis (violin and box plots) of H3K9me1 and H3K9me2 enrichments in different TE length groups for RLC and RLG combined in Spirodela. In all box plots, the mean is indicated by solid bar; the boxes extend from the first to the third quartile; and whiskers stretch to the furthest value within 1.5 times the interquartile range. (*) P-value < 0.001, (ns) not significant.


