
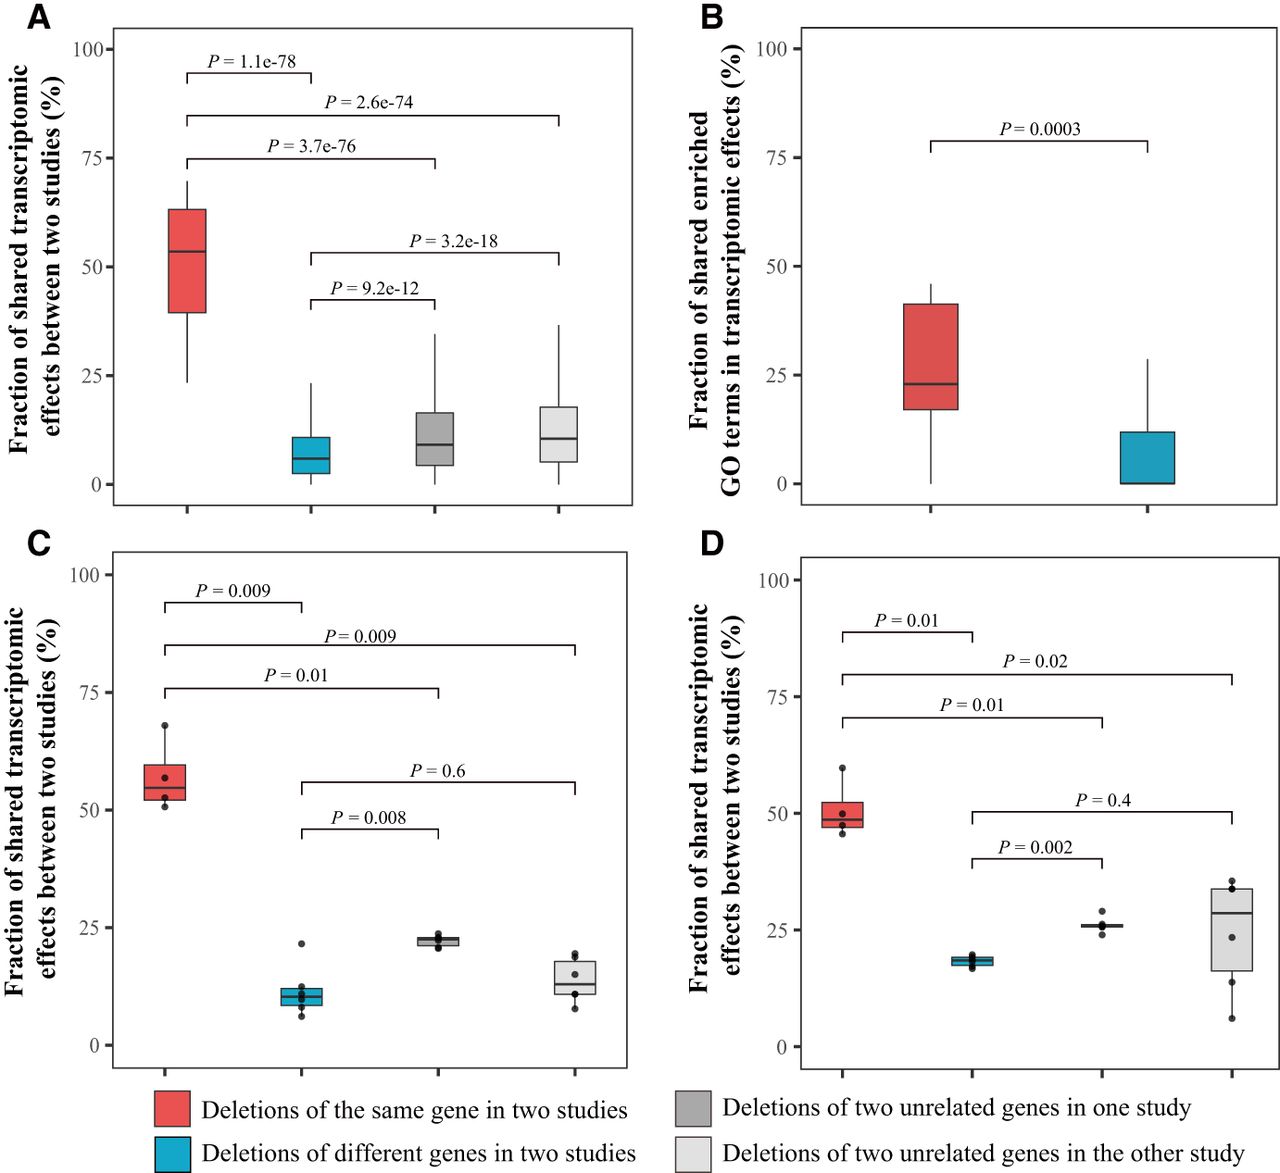
Comparison of the transcriptomic effects of budding yeast gene deletions detected in different studies. (A) Fraction of shared transcriptomic effects of Sce gene deletions between two microarray-based studies: Kemmeren et al. (2014) and Hu et al. (2007). (B) Fraction of shared enriched GO terms of transcriptomic effects between the above two studies. (C) Fraction of shared transcriptomic effects of four gene deletions (HAP2, HAP3, HAP4, and HAP5) between two microarray-based studies (Hu et al. 2007; Kemmeren et al. 2014). (D) Fraction of shared transcriptomic effects of the same four gene deletions between a microarray study (Kemmeren et al. 2014) and an RNA-seq study (Liu et al. 2020). (C,D) Each dot represents one comparison. In each panel, the lower and upper edges of a box represent the first (qu1) and third (qu3) quartiles, respectively; the horizontal line inside the box indicates the median (md); and the whiskers extend to the most extreme values inside inner fences; md ± 1.5(qu3−qu1). P-values are based on Mann–Whitney U tests.


