
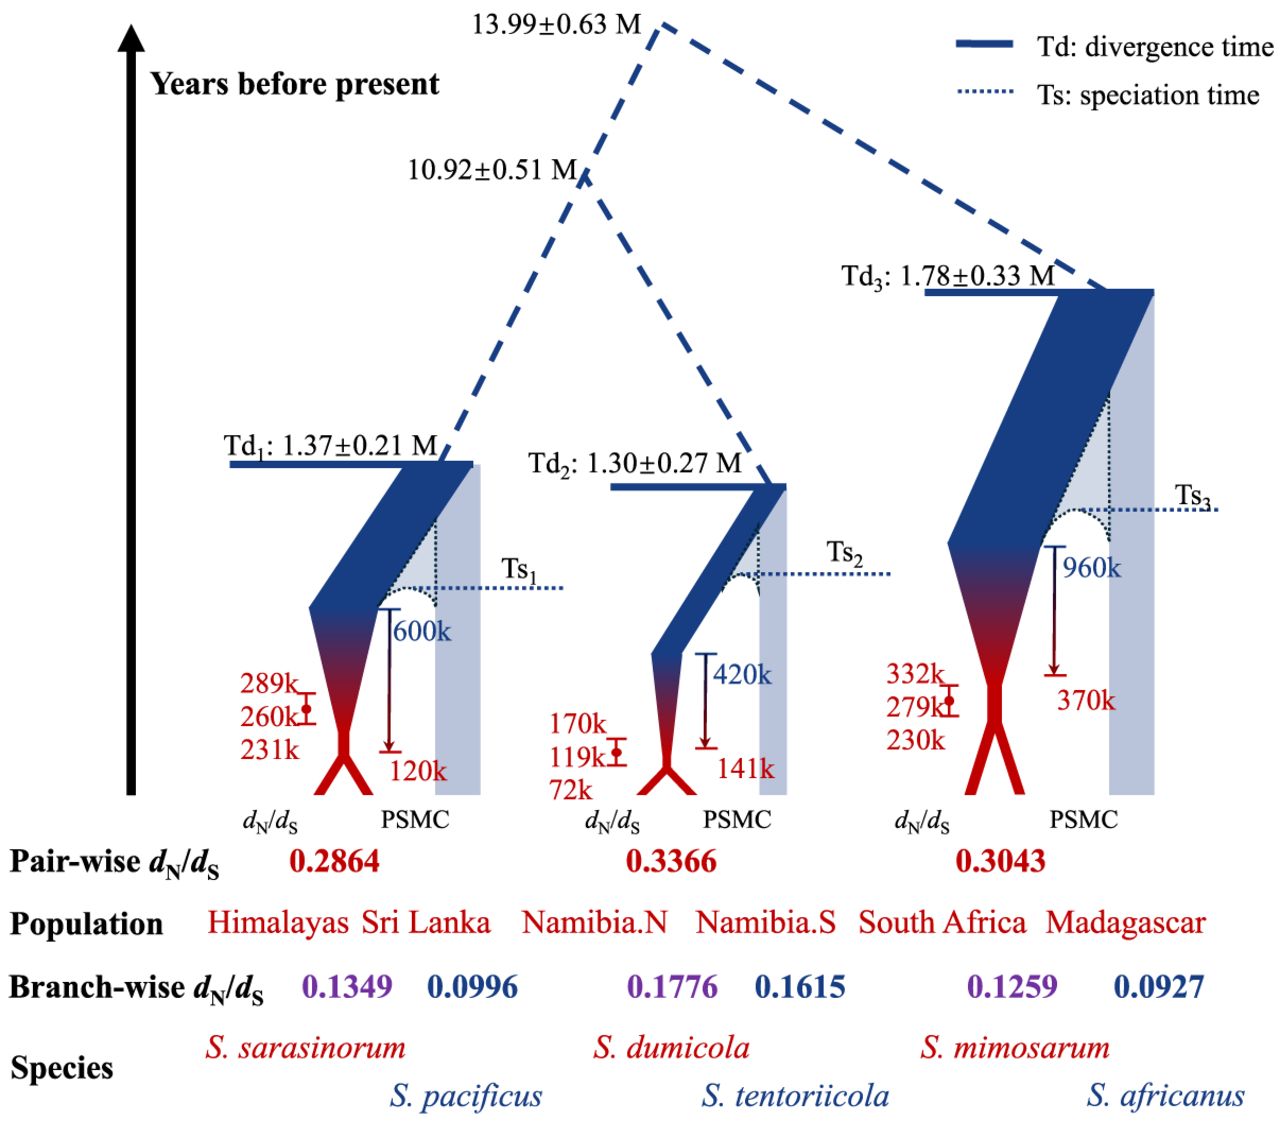
Estimated species divergence (Td) and the time of transition to sociality/cooperative breeding (indicated in red) in three independent social transitions within the Stegodyphus spider genus. Hypothetical speciation time (Ts) between each species pair is marked as the dashed lines. The scale of the plots is symbolic and not proportional. The widths of the terminal branches represent variation in effective population sizes, with red symbolizing social periods and blue indicating subsocial periods. Light blue branches represent species without chromosome-level assemblies for PSMC. For each lineage in which a social transition occurs, point estimates and 95% confidence intervals for social transition times are presented on the left, whereas social transition periods derived from population size history are displayed on the right. In PSMC estimations, the start of social transition periods corresponds to the initial decrease in effective population size, whereas the end coincides with Ne dropping below 50,000.


