
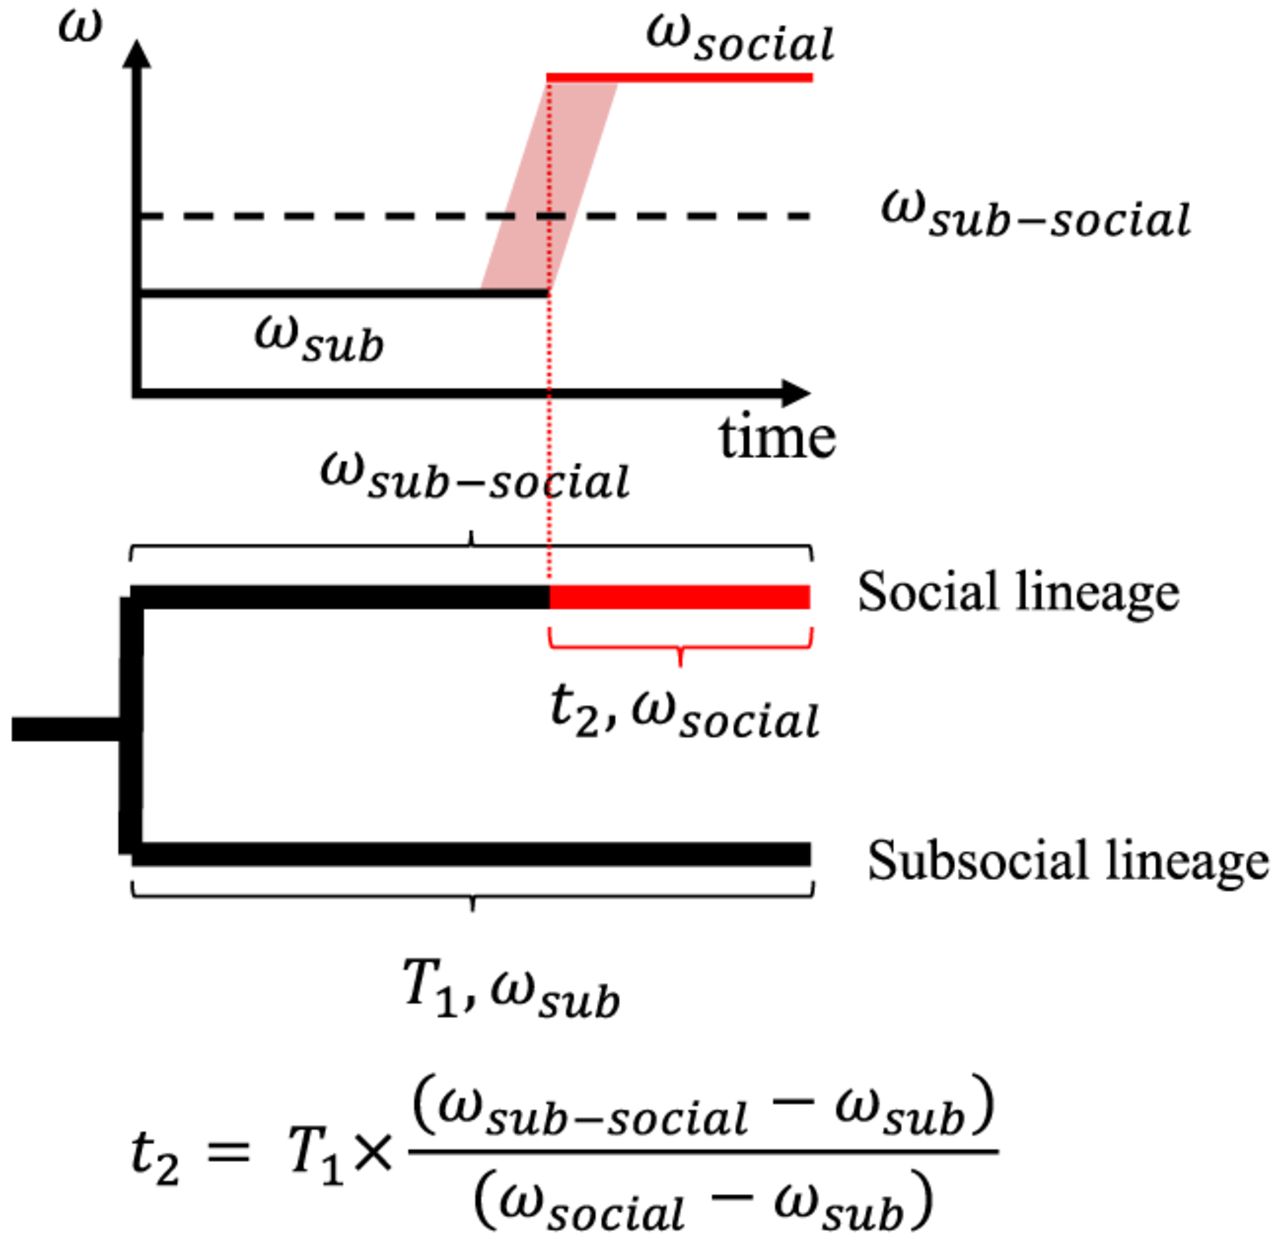
Figure 3.
Illustration for calculating the social period length for current social species as an instant process. t2 denotes the length of the social period. T1 denotes the divergence time between social species and its sister subsocial species. ωsub denotes the dN/dS estimated from the subsocial species branch in branch-wise PAML estimations. ωsub–social denotes the dN/dS estimated from the social species branch in branch-wise PAML estimations. ωsocial denotes the dN/dS (in practice, piN/piS) estimated from the pairwise PAML estimations of two separate social species populations. The red shadow region represents the scenario in which the dN/dS may increase as a continuous process.


