
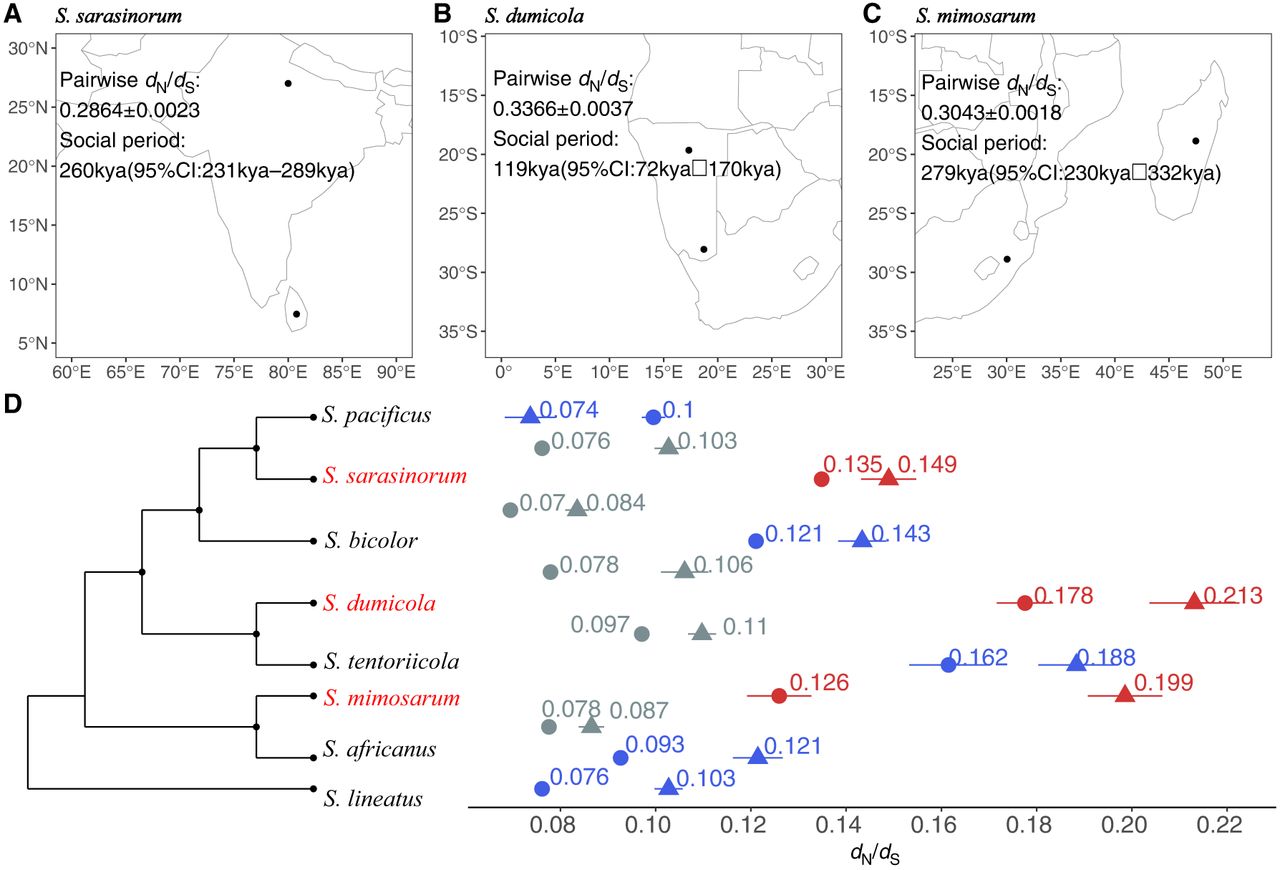
The intensity of purifying selection was assessed using dN/dS from the coding sequences of 2302 single-copy orthologous genes. (A) The locations of the Sri Lanka S. sarasinorum and Himalayas S. sarasinorum samples, along with their pairwise dN/dS estimations for the social period. (B) The locations of the Namibia South S. dumicola and Namibia North S. dumicola samples, with corresponding pairwise dN/dS estimations for the social period. (C) The locations of the South Africa S. mimosarum and Madagascar S. mimosarum samples and their pairwise dN/dS estimations for the social period. (D) Branch-wise dN/dS estimations using PAML, with the 95% confidence interval from resampling. Red, blue, and gray denote social species terminal branches, subsocial species terminal branches, and internal branches, respectively. The dN/dS estimation, indicated by points with circles and triangles denoting autosomes and X Chromosomes, respectively, is aligned to the phylogeny that corresponds to the respective branches. The phylogeny in D provides an indication of the topology without branch length information.


