
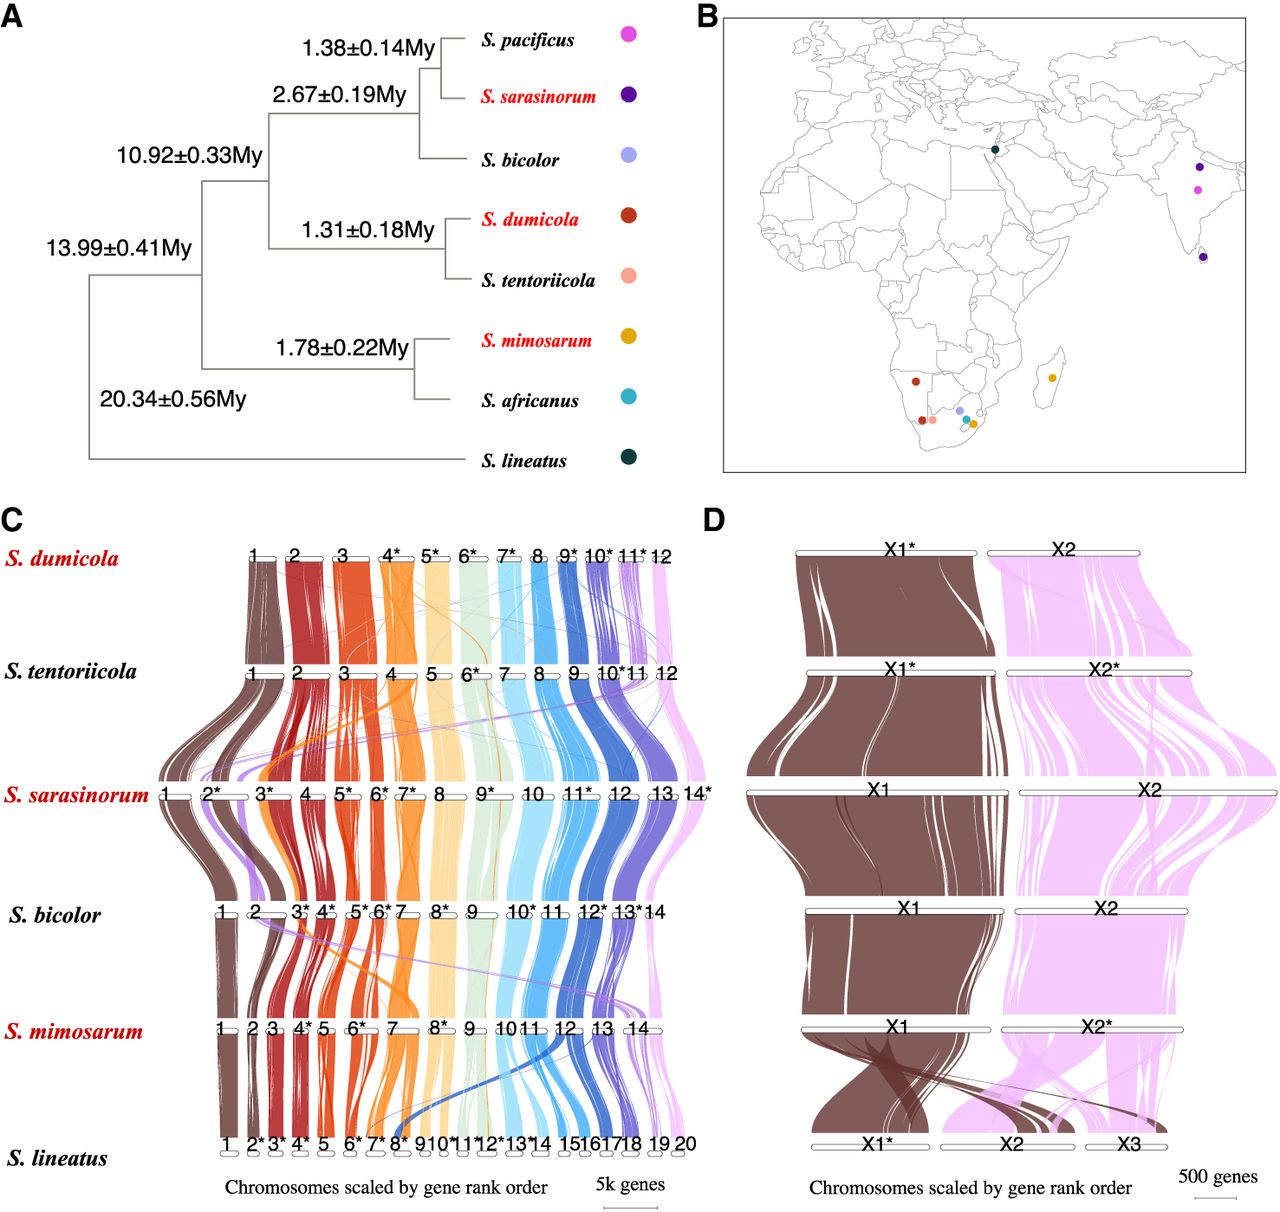
Overview of the genomic data collection. (A) Phylogeny of the spider genus Stegodpyhus with social species in red. The divergence time is estimated from the dS of autosomal single-copy orthologous genes and a yearly mutation rate of 5 × 10⁻⁹ per site per year. (B) Sampling locations of the species included in our study. The gene synteny plots among the six de novo chromosome-level assemblies are shown using GENESPACE, separately for autosomes (C) and X Chromosomes (D). The length of chromosomes in the gene synteny plot represents the number of genes. The IDs of chromosomes in C and D are labeled as the number we assigned in the assembled genome of each species. Asterisks mark chromosomes that are complementary-reversed in the synteny analysis.


