
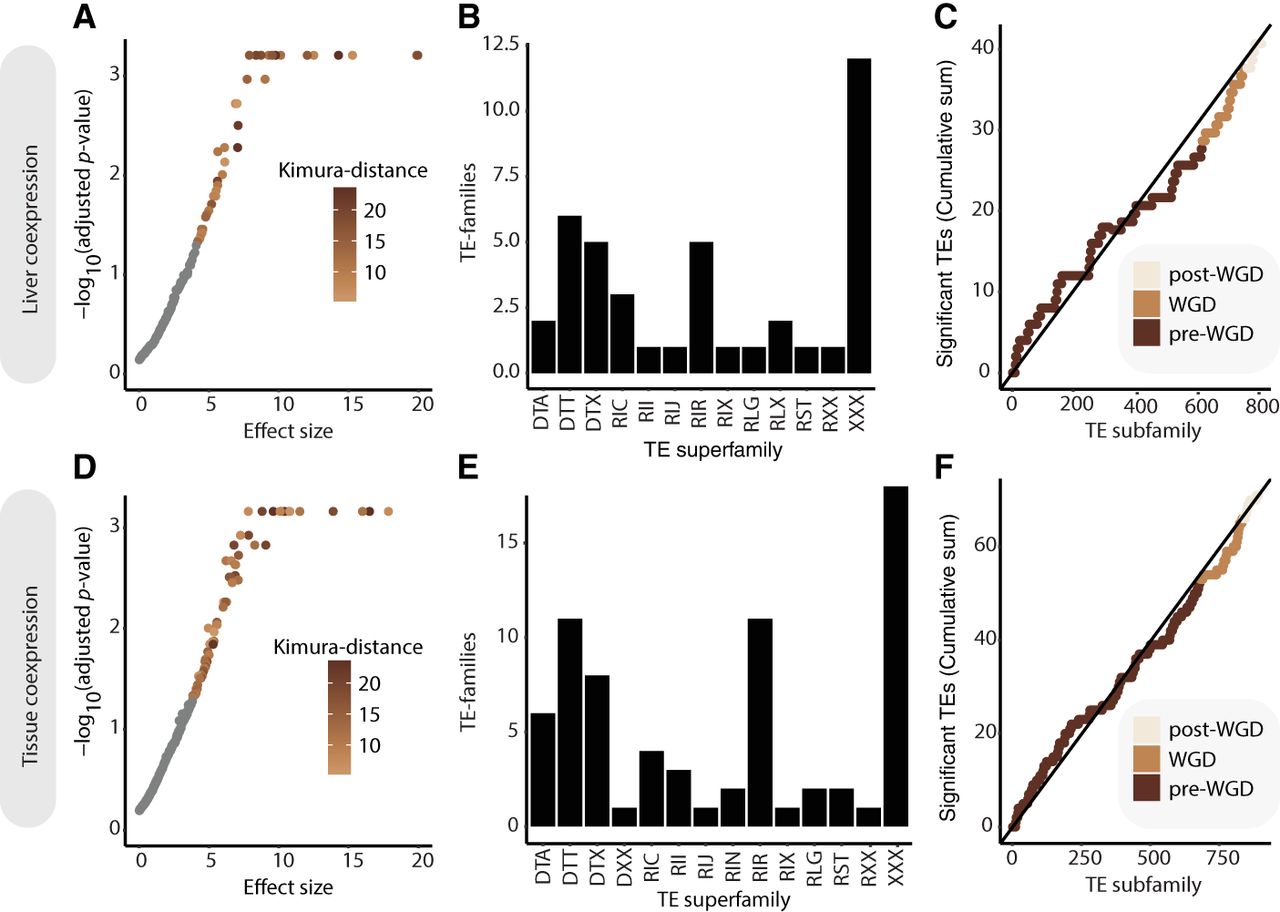
TE-CREs driving coexpression. (A–C) Results from liver coexpression. (D–F) Results from tissue atlas coexpression. (A,D) Significance (FDR-adjusted P-values) plotted against effect size (standard deviations) for each TE subfamily, indicating the strength of coexpression of their associated genes in the liver (A) and tissue atlas (D) coexpression networks, respectively. Points with FDR-adjusted P-value < 0.05 are colored by Kimura distance to TE-subfamily consensus. (B,E) Distribution of significant TE subfamilies grouped by superfamilies in liver (B) and tissue atlas (E) data sets. (C,F) Cumulative distribution of TE subfamilies with significant effect on gene coexpression in liver (C) and tissue atlas (F) data sets. Temporal classification was based on the mean divergence of all TE insertions to their TE subfamily consensus sequence, for which post-WGD was defined as Kimura distance < 7, WGD as 7–10, and pre-WGD as >10.


