
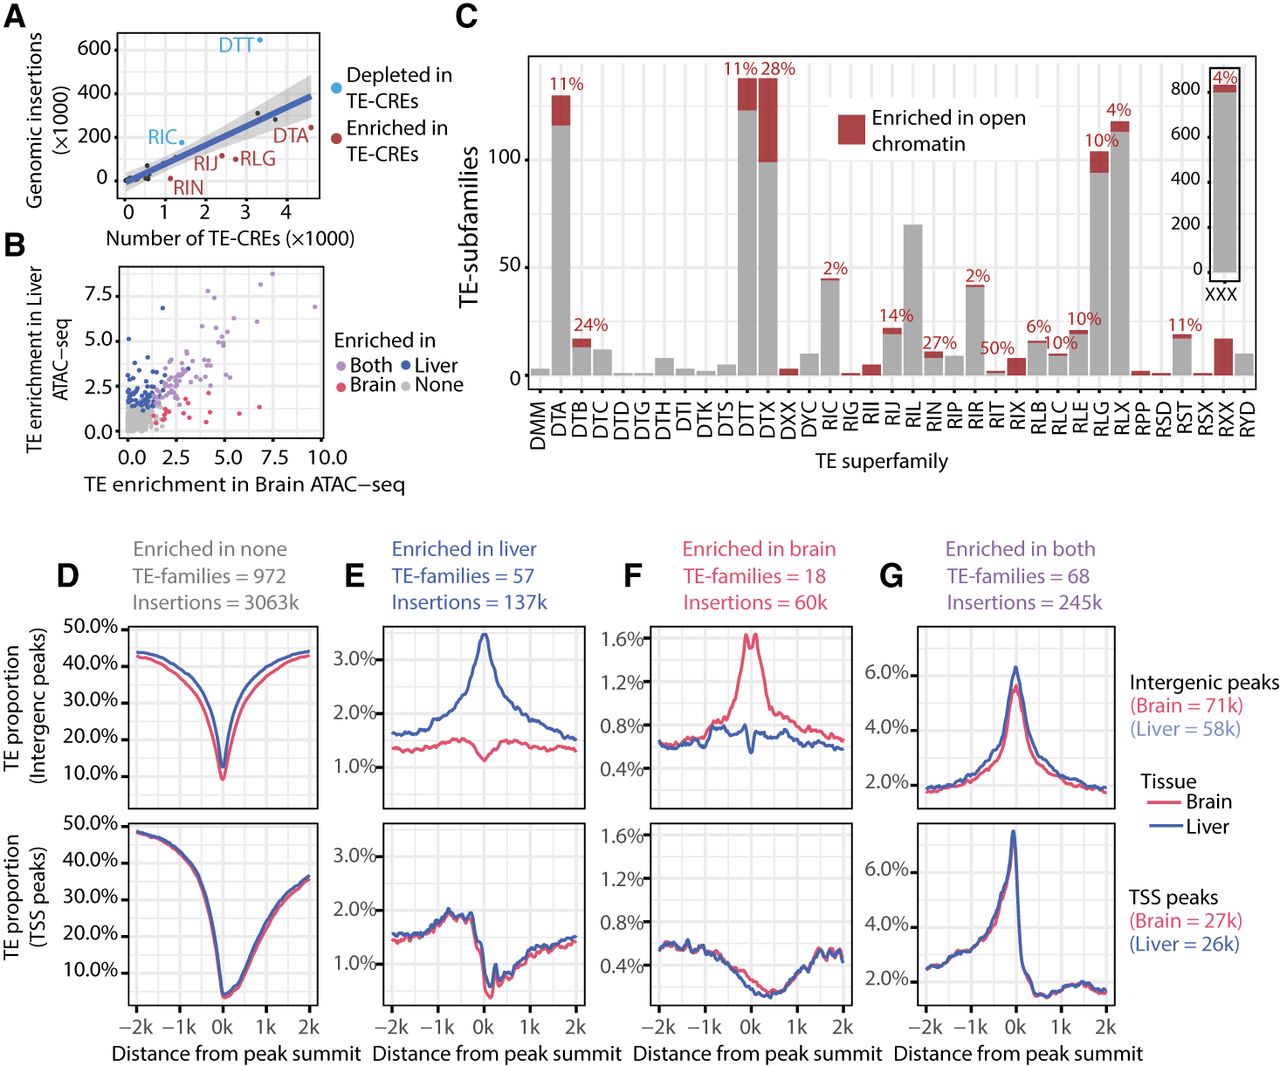
TEs enriched in open chromatin. (A) The number of insertions per superfamily plotted against the number of CREs in each superfamily. The shaded area is a 95% confidence-level interval. Superfamilies falling outside the 95% confidence interval are annotated with the three-letter superfamily code. (B) TE families (more than 500 genomic insertions) plotted according to fold enrichment within ATAC-seq peaks in the brain and liver. TE subfamilies are assigned into categories based on enrichment in liver, brain, or both. (C) Proportion of TE subfamilies enriched in open chromatin per superfamily. A manual curation step of the TE subfamilies enriched in open chromatin resulted in a slightly different superfamily list than the initial machine-predicted annotations presented in Figure 1. Note also that only TE subfamily sequences with more than 500 insertions have been included. The percentage of enriched TE subfamilies per superfamily are indicated above bars. (D–G) Proportion of base pair overlapping TEs from each enrichment category around peak summits in intergenic or promoter regions (summit within 500 bases of a TSS). Peaks in promoter regions are oriented according to the corresponding TSS with gene bodies to the right in figures.


