
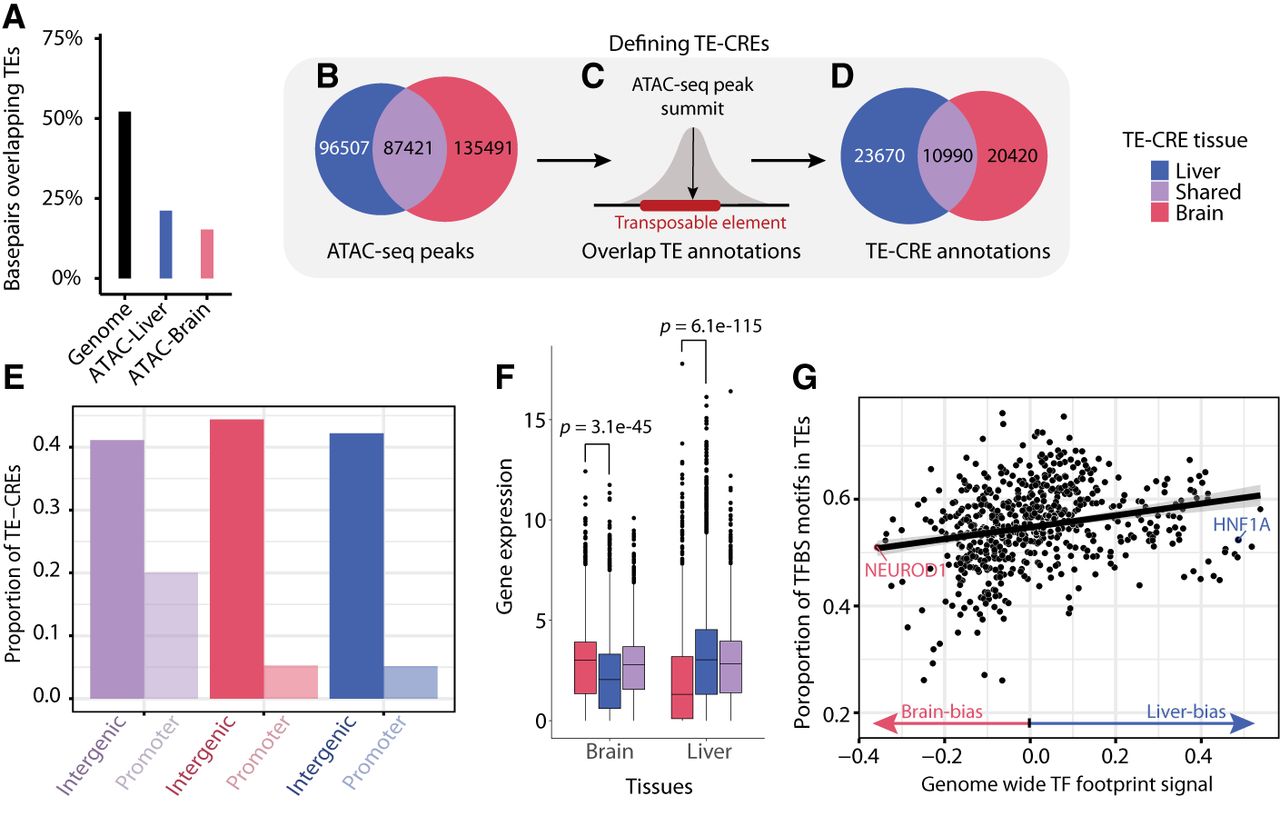
TE-CRE landscape. (A) The proportion of base pairs overlapping TEs, either from out of all genome-wide base pairs or from those within an ATAC-seq peak. (B–D) Pipeline to define putative TE-CREs. (B) Venn diagram of tissue-specific and shared ATAC-peaks from the liver and brain. (C) Cartoon showing how TE-CREs are defined as ATAC-seq peak summits when overlapping with a TE. (D) Venn diagram of tissue-specific and shared TE-CREs from liver and brain. (E) Proportion of shared and tissue-specific TE-CREs in promoter versus intergenic regions. (F) Gene expression levels of the nearest genes to tissue-specific and shared TE-CREs in the brain and liver. P-values from a Wilcoxon test are indicated above tissues. (G) Correlation between TF tissue specificity and the proportion of genome wide TF motif matches located in TEs. Each point represents a TF motif. Tissue specificity is based on differential TF binding score from TOBIAS (Bentsen et al. 2020), which essentially summarizes the relative ATAC-seq footprint signal across all potential binding sites.


