
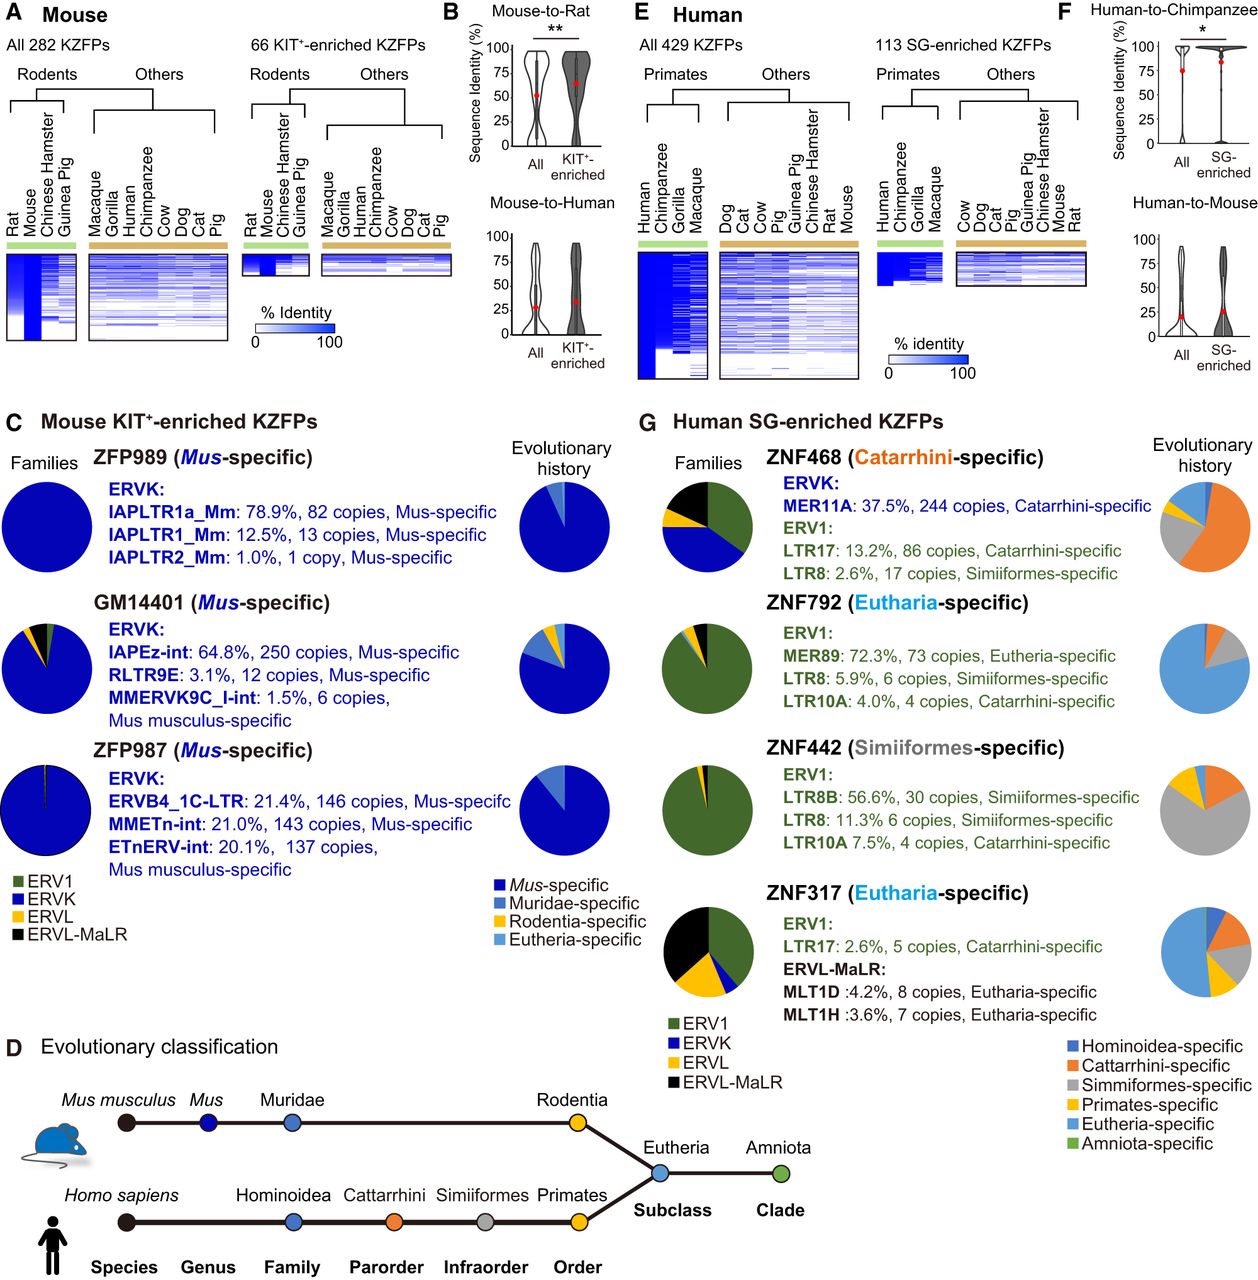
The evolutional aspects of KZFPs enriched in the mitotic spermatogonia. (A) The heatmap represents the identity of all 282 murine KZFPs (left) and 66 KIT+-enriched KZFPs (right) compared among mammalian species. The dendrogram represents the result of the hierarchical analysis, which categorizes all species into two groups. (B) The violin plot with a box plot overlay of the sequence identity of ALL KZFPs (white) and KIT+-enriched KZFPs (gray) between mice and rats (top) and mice and humans (bottom). The central lines represent medians. The upper and lower hinges correspond to the 25th and 75th percentiles. The upper and lower whiskers are extended from the hinge to the largest value no further than the 1.5X inter-quartile range (IQR) from the hinge. The red dots in the box plot are the average of the normalized enrichment. Mann–Whitney U test. (**) P < 0.01. (C) The left pie chart represents the proportion of subfamilies of target ERVs. The names of the ERV types shown in the middle represent the top three ERV types targeted by each KZFP. The right pie chart represents the proportion of evolutional ages of target ERVs. The evolutional history of each KZFP is shown in parentheses. (D) Schematics of evolutional clades for mice (top) and humans (bottom). (E) The heatmap represents the identity of all 429 murine KZFPs (left) and 113 KIT+-enriched KZFPs (right) compared among mammalian species. The dendrogram represents the result of the hierarchical analysis, which categorizes all species into two groups. (F) The violin plot with a box plot overlay of the sequence identity of All KZFPs (white) and KIT+-enriched KZFPs (gray) between humans and chimpanzees (top) and humans and mice (bottom). The central lines represent medians. The upper and lower hinges correspond to the 25th and 75th percentiles. The upper and lower whiskers are extended from the hinge to the largest value no further than the 1.5X IQR from the hinge. The red dots in the box plot are the average of the normalized enrichment. Mann–Whitney U test. (*) P < 0.05. (G) The evolutional age of four representative human SG-enriched KZFPs and their target ERVs. The left pie chart represents the proportion of subfamilies of target ERVs. The names of the ERV types shown in the middle represent the top three ERV types targeted by each KZFP. The right pie chart represents the proportion of evolutional ages of target ERVs.


