
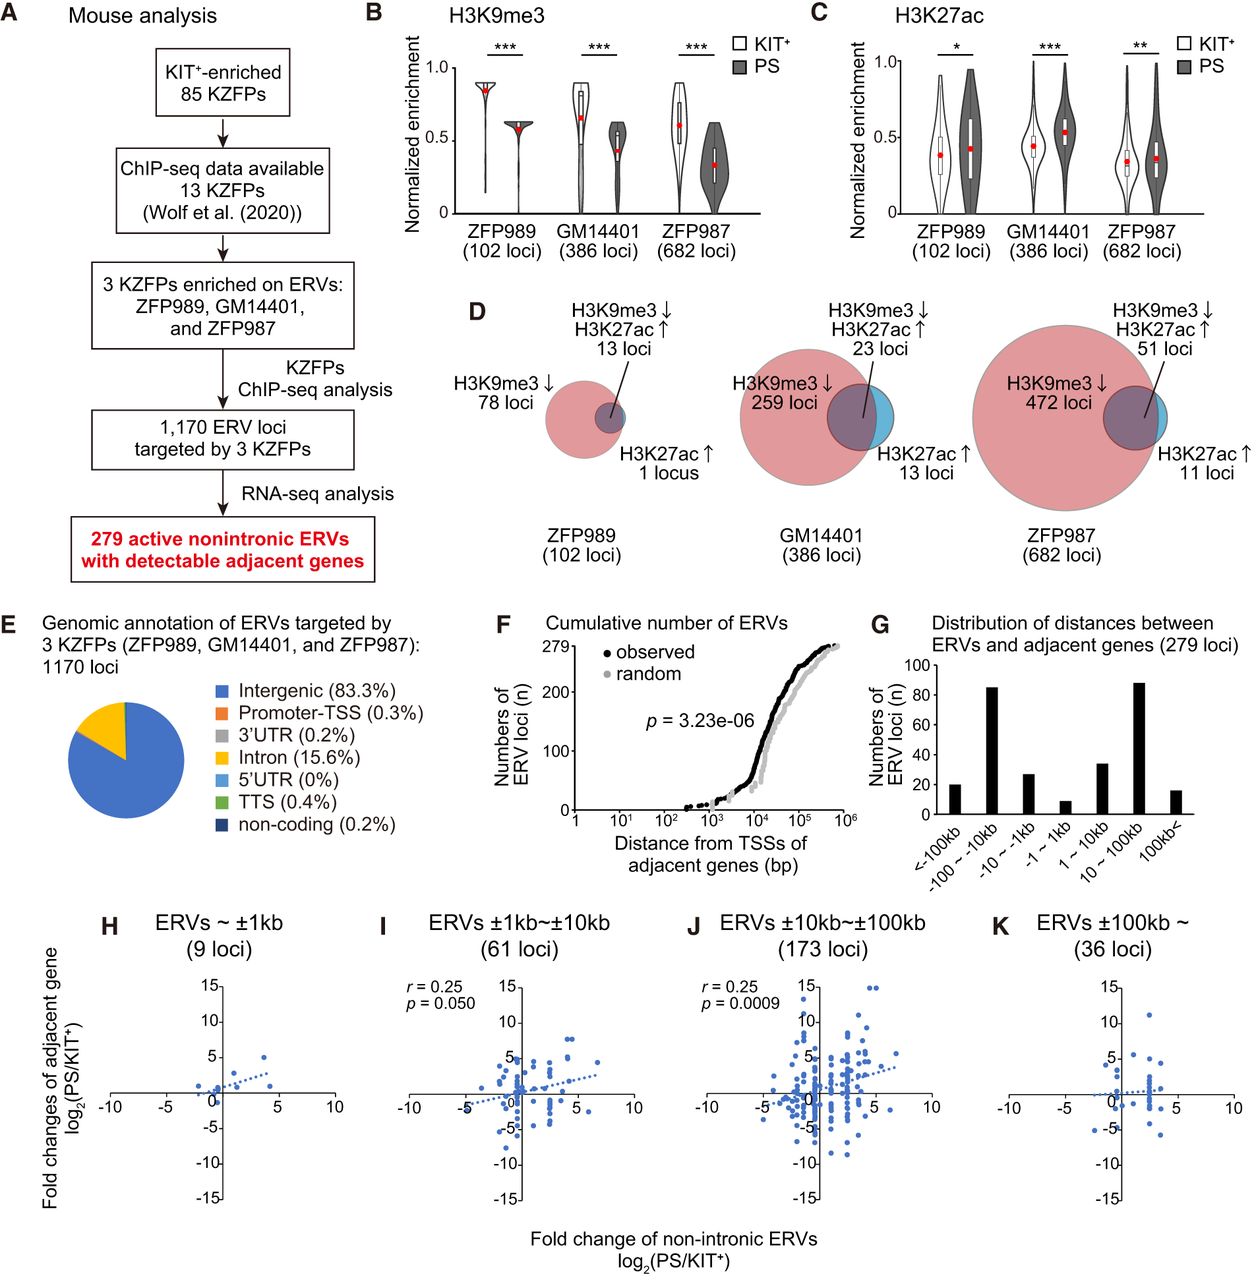
KZFPs target and suppress ERVs until the mitosis-to-meiosis transition. (A) Flowchart of analyses to identify target ERVs. (B,C) Normalized enrichment of H3K9me3 (B) and H3K27ac (C) at the target ERV loci in KIT+ and PS. Violin plot with a box plot overlay of the normalized enrichment of each histone modification. The central lines represent medians. The upper and lower hinges correspond to the 25th and 75th percentiles. The upper and lower whiskers are extended from the hinge to the largest value no further than the 1.5× inter-quartile range (IQR) from the hinge. The red dots in the box plot are the average of the normalized enrichment. Paired t-test. (***) P < 0.001, (**) P < 0.01, (*) P < 0.05. (D) Overlap between the target ERV loci at which H3K9me3 decreased and H3K27ac increased. (E) Genome annotation of the ERV loci targeted by ZFP989, GM14401, and ZFP987. Each proportion is shown in parentheses. (F) Cumulative curve of 279 active nonintronic ERVs targeted by ZFP989, GM14401, and ZFP987, based on the distances to the most adjacent TSSs. The gray dots represent the distance from randomly chosen ERVs to the most adjacent TSSs. D and P-value are calculated by the Kolmogorov–Smirnov test. (G) Distances between 279 active nonintronic ERVs targeted by ZFP989, GM14401, and ZFP987 and their adjacent genes. (H–K) Correlation between expression of the adjacent gene and nonintronic ERVs at the mitosis-to-meiosis transition (PS/KIT+). All nonintronic ERVs were separated into four groups according to the distance to the most adjacent genes. The correlation coefficient (r) and P-value were calculated on panels with more than 50 plots (I,J).


