
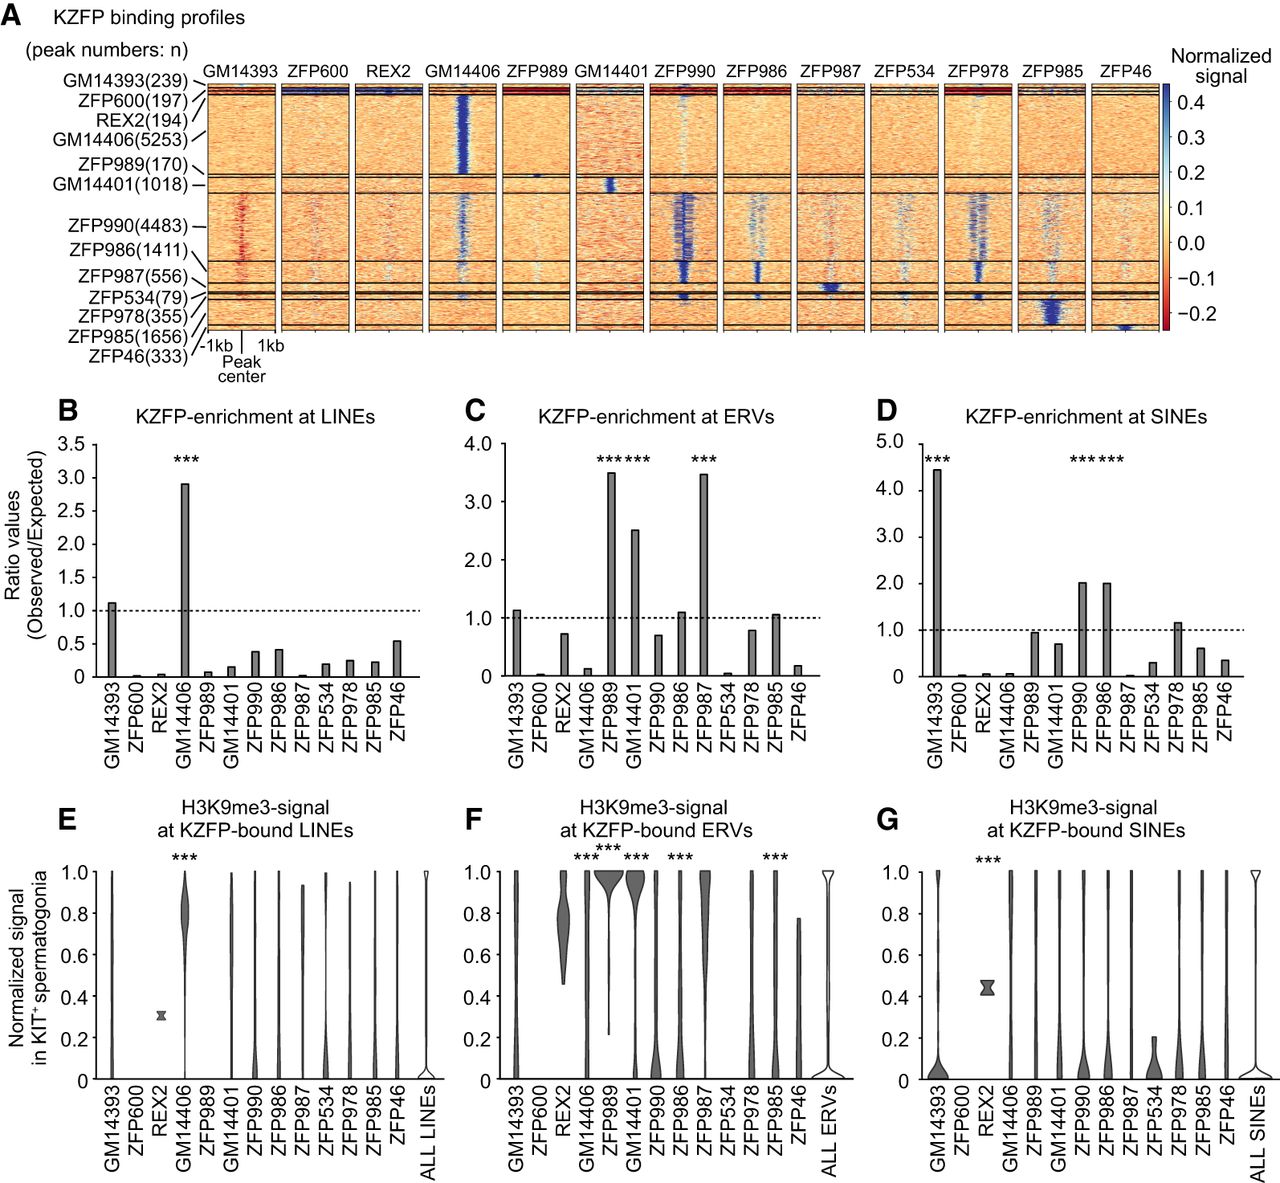
Binding preference of KIT+ spermatogonia-enriched KZFPs and the H3K9me3 enrichment. (A) Heatmap of the binding profiles of KIT+ spermatogonia-enriched KZFPs. The numbers in parentheses represent the numbers of detected peaks. (B–D) Binding preference of KZFPs at LINEs (B), LTRs (C), and SINEs (D). The bar plot represents the ratio value of the observed numbers of peaks versus the theoretically expected numbers of peaks. Binomial test. (***) P < 0.001. (E–G) Violin plots showing the data distribution of normalized H3K9me3 signals at each KZFP-bound LINEs (E), LTRs (F), and SINEs (G) compared with enrichment at all interspersed copies in KIT+ spermatogonia. The width of the plot illustrates the data density. Mann–Whitney U test. (***) P < 0.001.


