
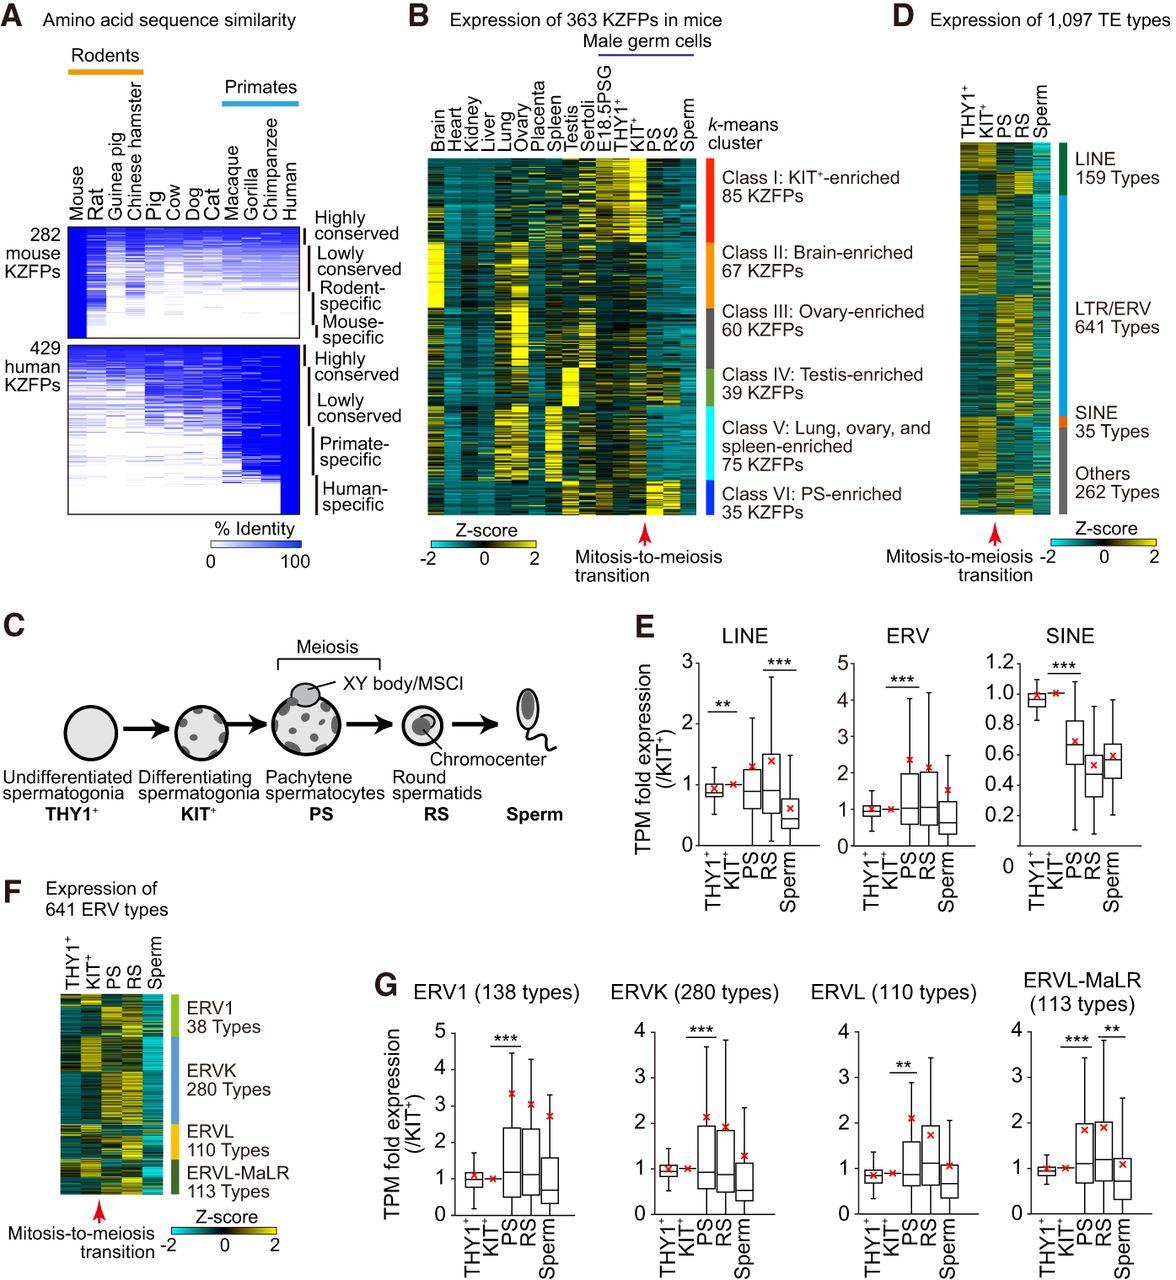
Expression of KZFPs and TEs during mouse spermatogenesis. (A) Amino acid sequence identities of 282 murine KZFPs (top) and 429 human KZFPs (bottom) among 12 mammalian species. All mouse and human KZFPs registered in the BioMart database (282 for mice and 429 for humans) were analyzed. (B) A heatmap showing a k-means clustering analysis of expression (RNA-seq data) for all protein-coding KZFPs in various tissues and testicular cell types in mice. (E18.5PGC) Prospermatogonia from E18.5 testis, (THY1+) THY1+ undifferentiated spermatogonia, (KIT+) KIT+ differentiating spermatogonia, (PS) pachytene spermatocytes, and (RS) round spermatids. (C) Schematic of mouse spermatogenesis and the five representative stages. (D) A heatmap showing the expression (RNA-seq data) of all detected TE types in male germ cells at the representative five stages. (E,G) Relative expression (RNA-seq data) of each TE class (E) and each ERV subclass (G) during spermatogenesis. Box-and-whisker plots showing distributions of RNA-seq read data. The central lines represent medians. The upper and lower hinges correspond to the 25th and 75th percentiles. The upper and lower whiskers are extended from the hinge to the largest value no further than the 1.5× inter-quartile range (IQR) from the hinge. The values of KIT+ were set to one. The red crosses represent the average values. Pairwise permutation ANOVA test (nonparametric test). (**) P < 0.01, (***) P < 0.001. (F) A heatmap showing the expression (RNA-seq data) of all ERV types in mouse spermatogenesis.


