
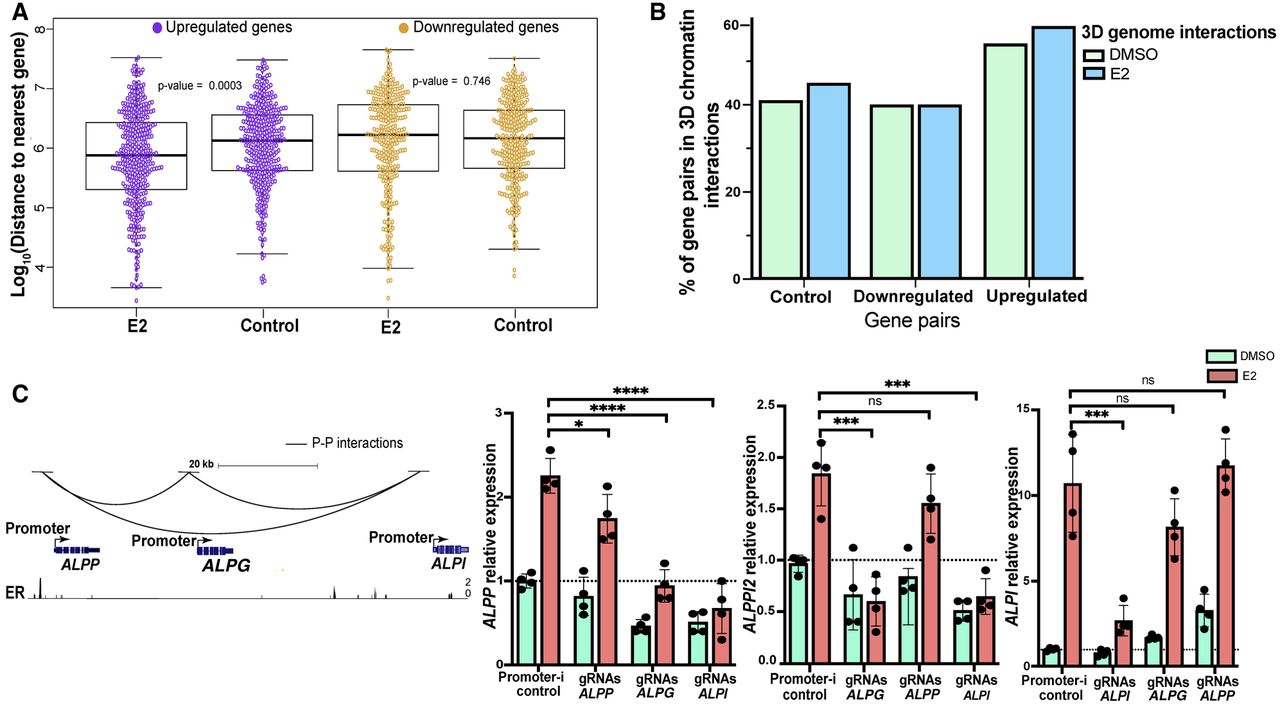
E2-upregulated gene promoters are enriched in physical interactions that can mediate their transcriptional response to estrogen. (A) The plot displays the genomic distances among E2-responsive genes or randomly selected control genes that match in the number of genes. Upregulated genes and matching control genes are shown in purple; downregulated genes and matching controls are shown in yellow. (B) Bar plot shows the percentage of E2-regulated or randomly selected (control) gene pairs within 150 kb that have promoter–promoter interactions (left, control genes; middle, downregulated genes; right, upregulated genes) observed under DMSO (green) or E2 (blue) treatment conditions. (C, left) Genome Browser tracks of ALPP-ALPG-ALPI gene cluster displaying promoter–promoter interactions and ER ChIP-seq signal. (Right) Relative expression with DMSO (green) or E2 (orange) treatment of each gene when the genes’ promoters in the cluster are targeted by Enhancer-i is displayed. Error bars represent the SD. (****) P < 0.00001, (***) P < 0.001, and (*) P < 0.05, unpaired t-test; (ns) statistical insignificance.


