
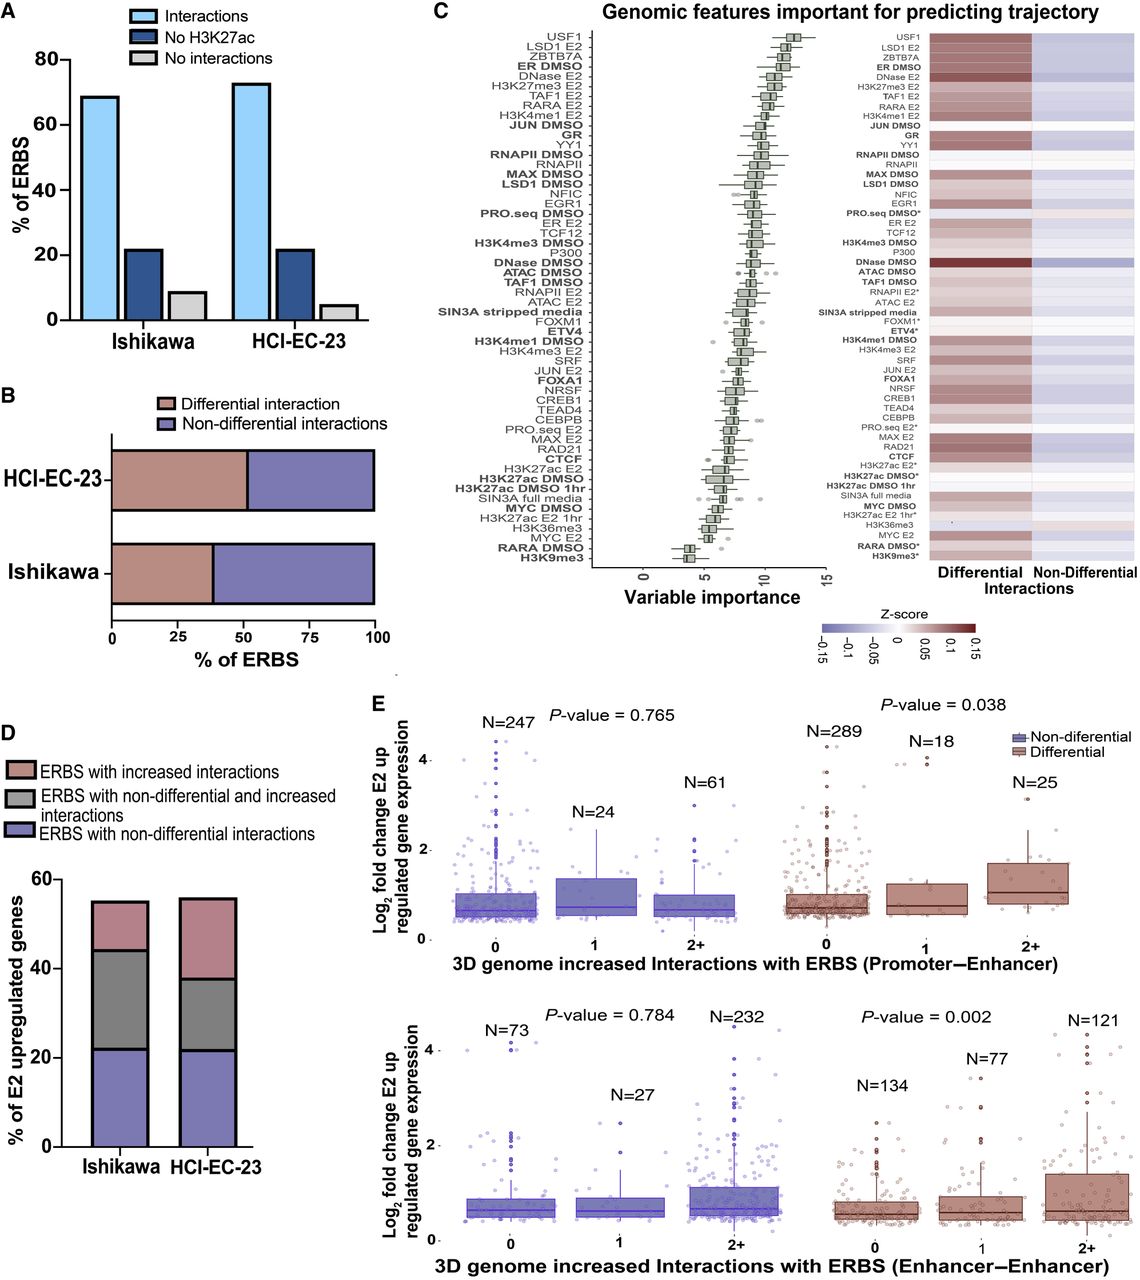
ERBSs exhibit distinctive features when involved in differential 3D genome interactions. (A) The bar graph portrays all ERBSs associated with 3D genome interactions and their classifications in endometrial cell lines. (B) Of the ERBSs found in 3D genome interactions (light blue in panel A), the bar graph indicates the percentage that anchors differential 3D genome interactions. (C, left) A ranking of genomic features based on their importance for ERBSs associated with differential or nondifferential 3D genome interactions (exhibited in panel B) is shown. Data sets shown in bold were performed in the absence of ER activation. (Right) Heatmap displays the average signal intensity for top-ranked genomic features clustered by ERBSs with differential or nondifferential 3D genome interactions. Each feature's distributions were significantly different between groups based on a Kruskal–Wallis test (false-discovery rate < 0.05) with the exception of features marked with an asterisk. (D) Bar graph shows the percentage of E2-upregulated genes associated with ERBSs in differential or nondifferential 3D genome interactions (from B) within 100 kb of their TSSs. (E) Box plots show fold change for E2-upregulated genes with at least one ERBS within 100 kb of their TSSs in Ishikawa cells split by the number of nondifferential (left; blue) or differential (right; red) promoter–enhancer (top) or enhancer–enhancer (bottom) chromatin loops anchored by ERBSs. P-values are calculated as t-tests of the linear regression coefficients being different from zero.


