
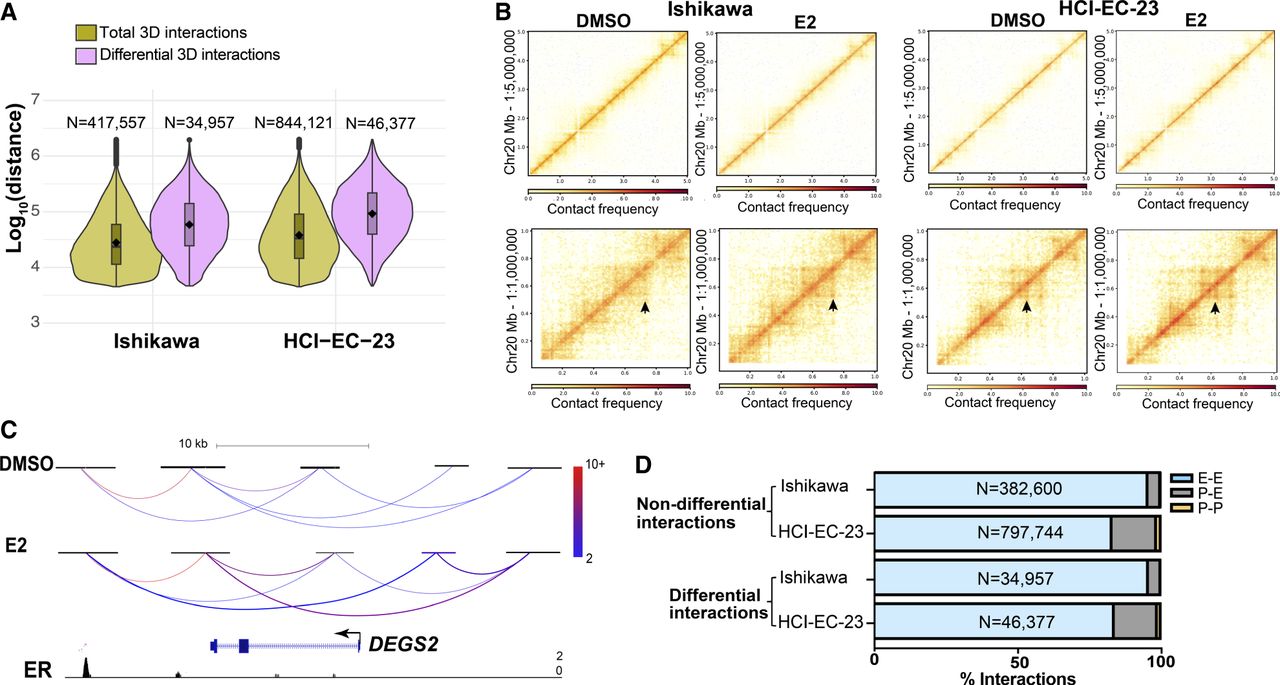
3D genome structure changes upon estrogen induction. (A) Violin plots show distance between anchors for all 3D genome interactions (green) and differential interactions (purple) in Ishikawa (left) and HCI-EC-23 (right) cell lines identified by HiChIP. (B) Heatmaps show portions of Chromosome 20 HiChIP signal for DMSO and E2 samples in Ishikawa (left) and HCI-EC-23 (right) cell lines. The top panels represent lower resolution; bottom panels display higher resolution. (C) HiChIP 3D genome interactions at the DEGS2 locus in Ishikawa cells are shown where the color of the chromatin loops represents the normalized read depth, and the two differential chromatin loops are shown as thicker in the E2 track. ChIP-seq browser track of ER upon E2 treatment is displayed at the bottom. (D) Genomic distribution of nondifferential and differential 3D genome interactions in Ishikawa and HCI-EC-23 cell lines are shown in terms of promoter–promoter (P-P), promoter–enhancer (P-E), and enhancer–enhancer (E-E) interactions.


