
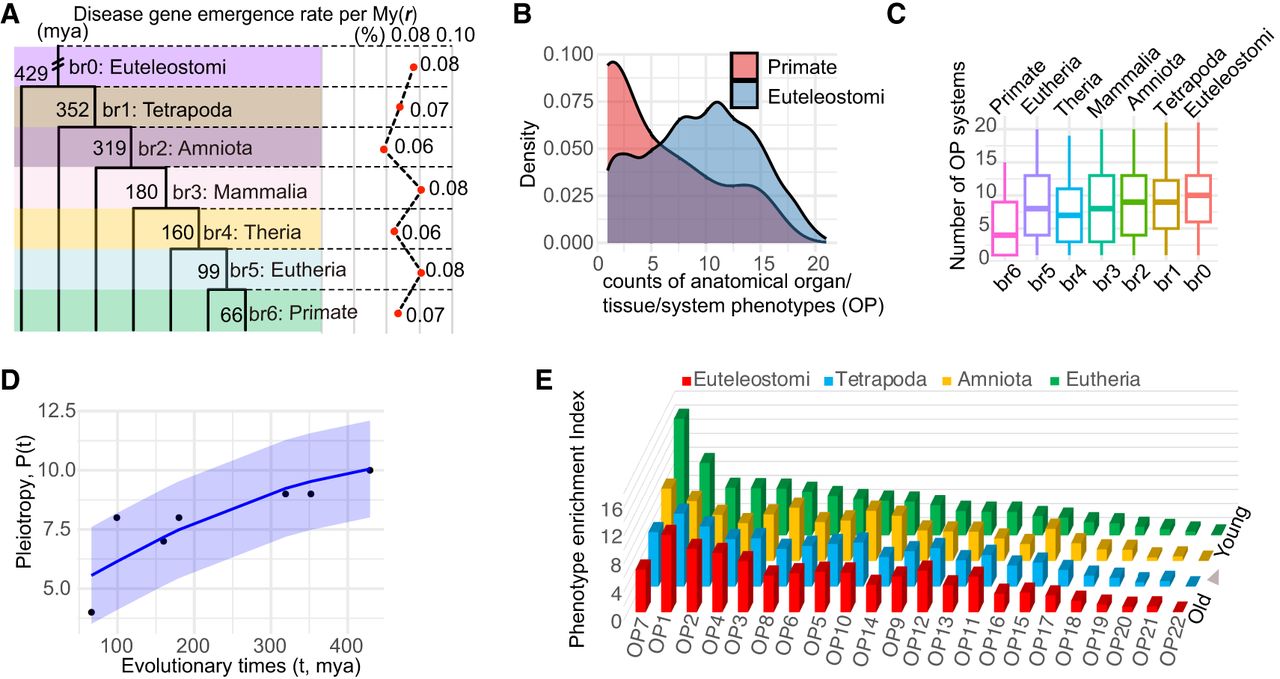
Disease gene emergence rates along phylostrata, OP counts comparison between the youngest and oldest phylostrata, and disease
PEI along phylostrata. (A) The disease–gene emergence rate per million years (r) along phylostrata. (B) Density distributions showcase numbers of affected organ phenotypic (OP) systems for genes originated at primate and Euteleostomi
phylostrata. (C) Box plot distributions showcase the numbers of affected OP systems for genes grouped by their phylostrata (median values
are four, eight, seven, eight, nine, nine, 10, from left to right). (D) The nonlinear least squares (NLS) regression between pleiotropy score (P) and evolutionary times t with the logistic growth function:  , k = 1.66, P = 0.000787. The 95% confidence interval is shown shade. P_max and P_0 are empirical medians 10 and four, respectively. (E) The distribution of phylostrata and OP for PEI. The bar plots, colored differently, represent phylostrata, namely, Euteleostomi,
Tetrapoda, Amniota, and Eutheria, in ascending order of evolutionary ages. The disease systems (OPs) are displayed on the
horizontal axis and defined in Figure 1C. The SDs of PEI are 3.67 for Eutheria and approximately 2.79 for older phylostrata.
, k = 1.66, P = 0.000787. The 95% confidence interval is shown shade. P_max and P_0 are empirical medians 10 and four, respectively. (E) The distribution of phylostrata and OP for PEI. The bar plots, colored differently, represent phylostrata, namely, Euteleostomi,
Tetrapoda, Amniota, and Eutheria, in ascending order of evolutionary ages. The disease systems (OPs) are displayed on the
horizontal axis and defined in Figure 1C. The SDs of PEI are 3.67 for Eutheria and approximately 2.79 for older phylostrata.


