
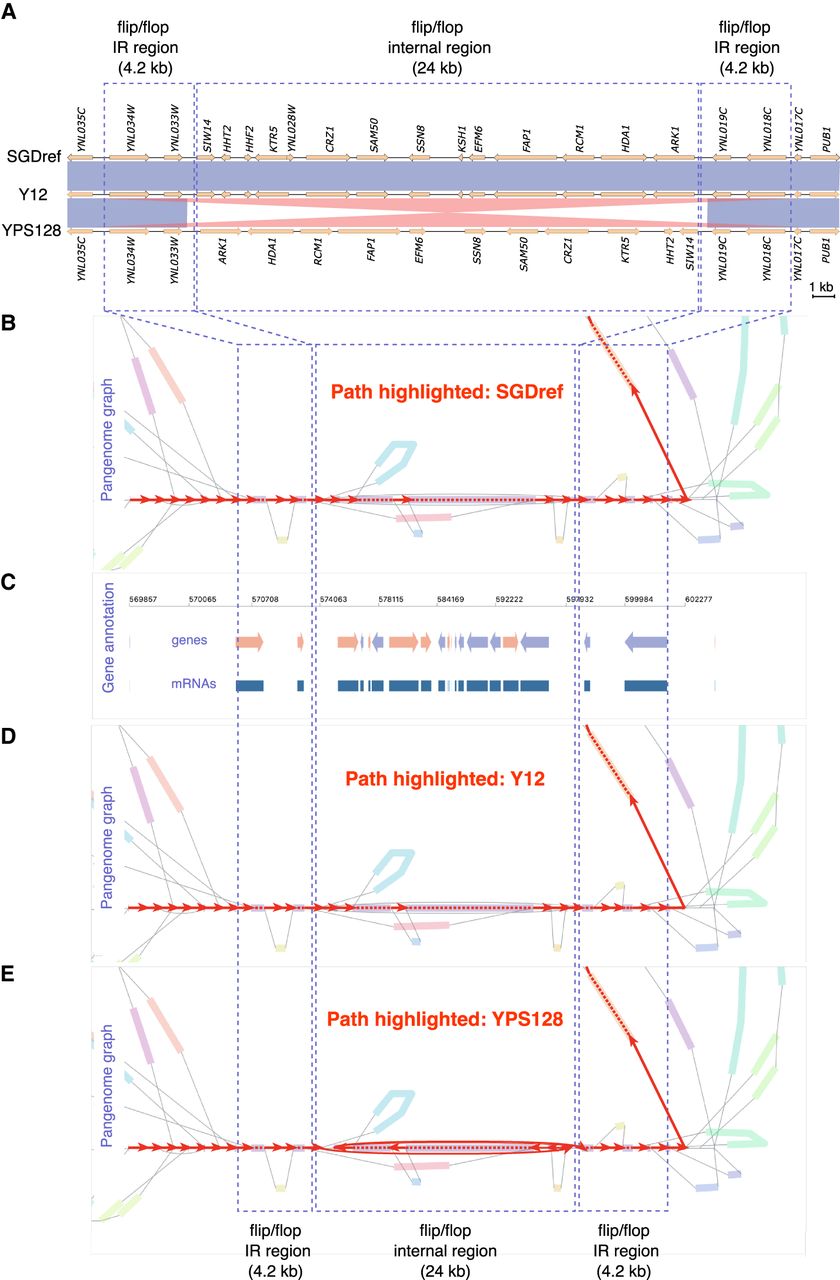
VRPG's visualization of the Chromosome XIV (Chr XIV) flip/flop region in a yeast pangenome graph. (A) The genome sequence and synteny comparison among SGDref (S288C), Y12, and YPS128 for the Chr XIV flip/flop region, with the red and blue shades representing homologous regions shared with >97% sequence similarity. Blue indicates same direction as shown in the flip/flop IR regions; red, reverse direction as shown in the flip/flop internal region. (B–D) VRPG visualization for the graph in this region (Chr XIV: 569,857–602,365, SGDref coordinates). The assembly paths of SGDref (B), Y12 (D), and YPS128 (E) are highlighted, respectively, with the SGDref-based coordinate system and gene annotation track (C) further shown in between. No layout simplification or node scaling was applied in VRPG for this visualization. All other options were left with defaults.


