
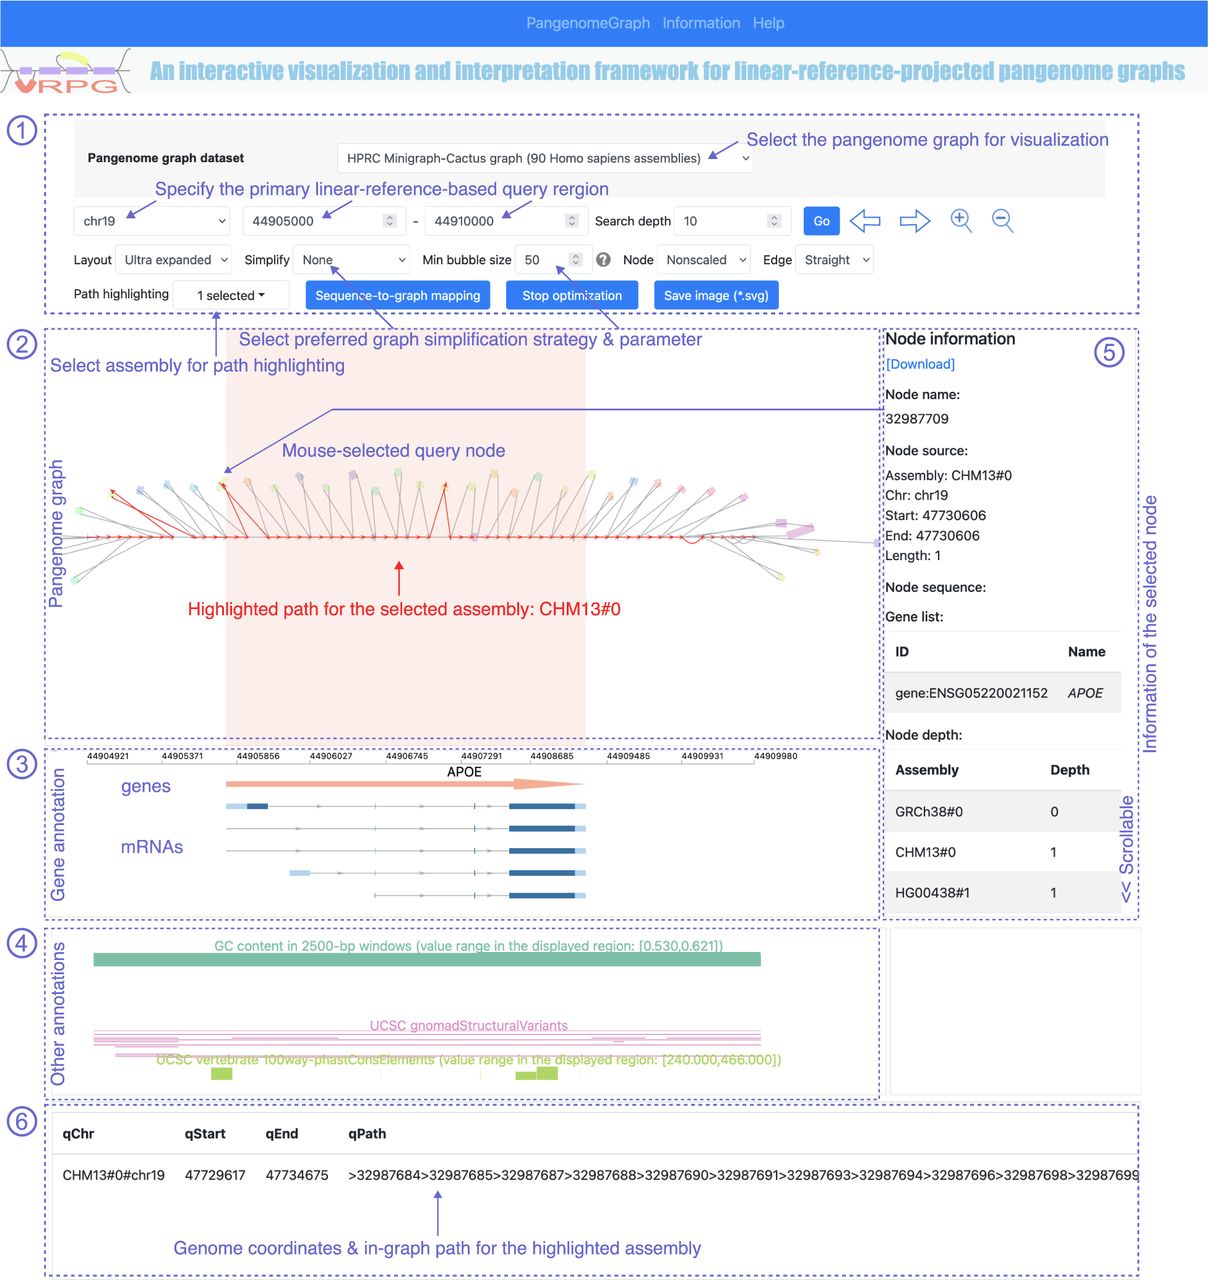
The interactive user interface of VRPG when opened in a web browser. After selecting the input pangenome graph data set, users can interactively visualize, navigate, and query the pangenome graph via a primary linear reference–based coordinate system. An example of the human APOE gene region (Chr 19: 44,905,000–44,910,000, GRCh38 coordinates) of the HRPC Minigraph-Cactus pangenome graph is shown here. The APOE gene bears strong associations with cardiovascular diseases and Alzheimer's disease. No layout simplification or node scaling was applied in VRPG for this visualization. Path highlighting for CHM13 was selected. All other options were left with defaults.


