
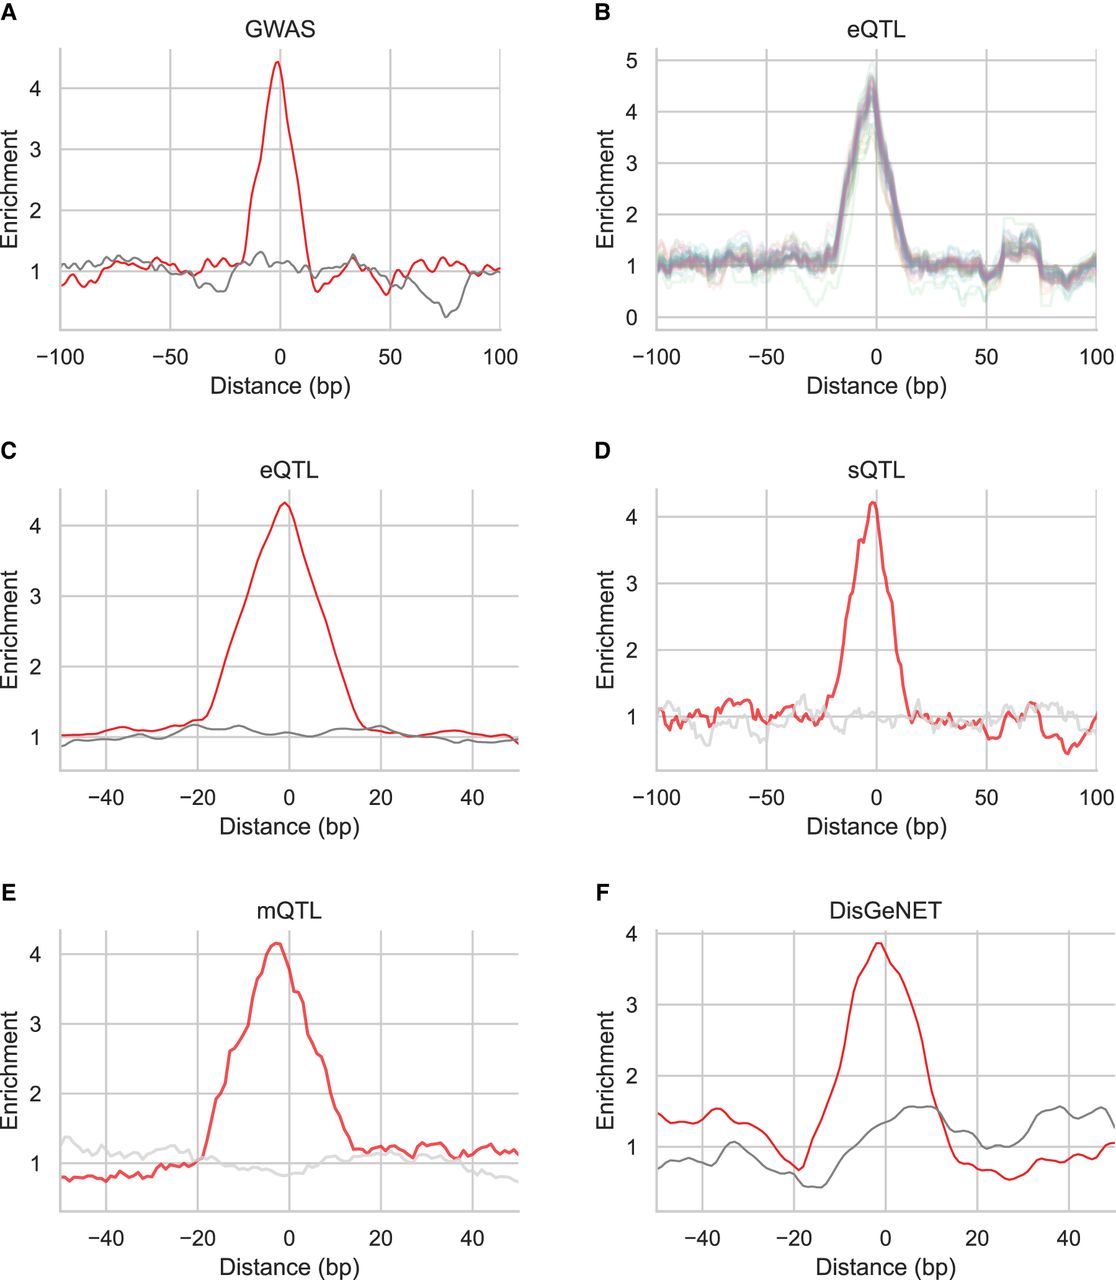
Figure 7.
Analysis of disruptive and regulatory variants. (A) Enrichment of human quasi-primes at and around GWAS variant loci. (B) Enrichment of human quasi-primes at and around eQTL loci. Each line represents a tissue. (C) Enrichment of human quasi-primes at and around multitissue eQTL loci. Enrichment of human quasi-primes at eQTL loci. (D) Enrichment of human quasi-primes at and around sQTL loci. (E) Enrichment of human quasi-primes at and around mQTL loci. (F) Enrichment of human quasi-primes at and around DisGeNET-derived loci. Gray lines represent the enrichment for simulated controls of human quasi-prime.


