
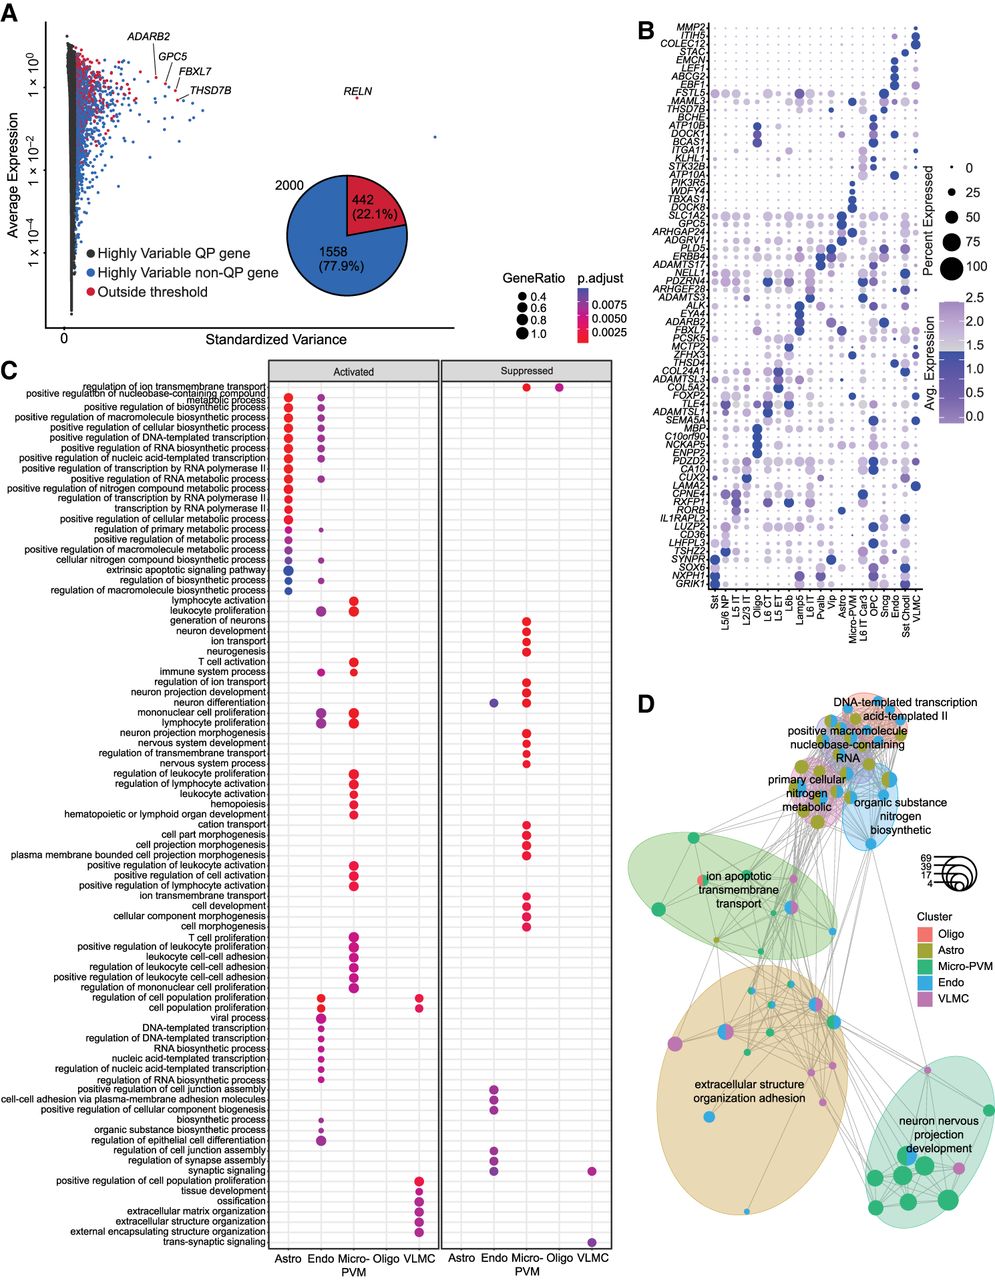
Differentially expressed genes associated with quasi-prime sequences among cell types found in the human single-cell primary motor cortex brain atlas. (A) Two thousand genes were thresholded by variation to capture the highly variable genes. The resulting highly variate genes were labeled either as genes with quasi-prime loci or without. Four hundred forty-two genes associated with quasi-prime loci (22.1%) capture high levels of variation as shown in the pie chart (Fisher's exact test P-value: 1.613 × 10−173, effect size: 0.165, odds ratio: 2.7). (B) Differential expression of quasi-prime genes thresholded by an absolute log2 fold change > 1 and P adjusted value < 0.05 represented by a dot plot. The top four most significant genes per above cell type ranked by positive log2 fold change are shown. (C) Differentially expressed quasi-prime genes were utilized in gene set enrichment analysis of the Gene Ontology (GO) database representing the top 20 terms per category thresholded by a P-value < 0.01. (D) A cmap network graph shows the clustering of top categories in the GO term GSEA analysis.


