
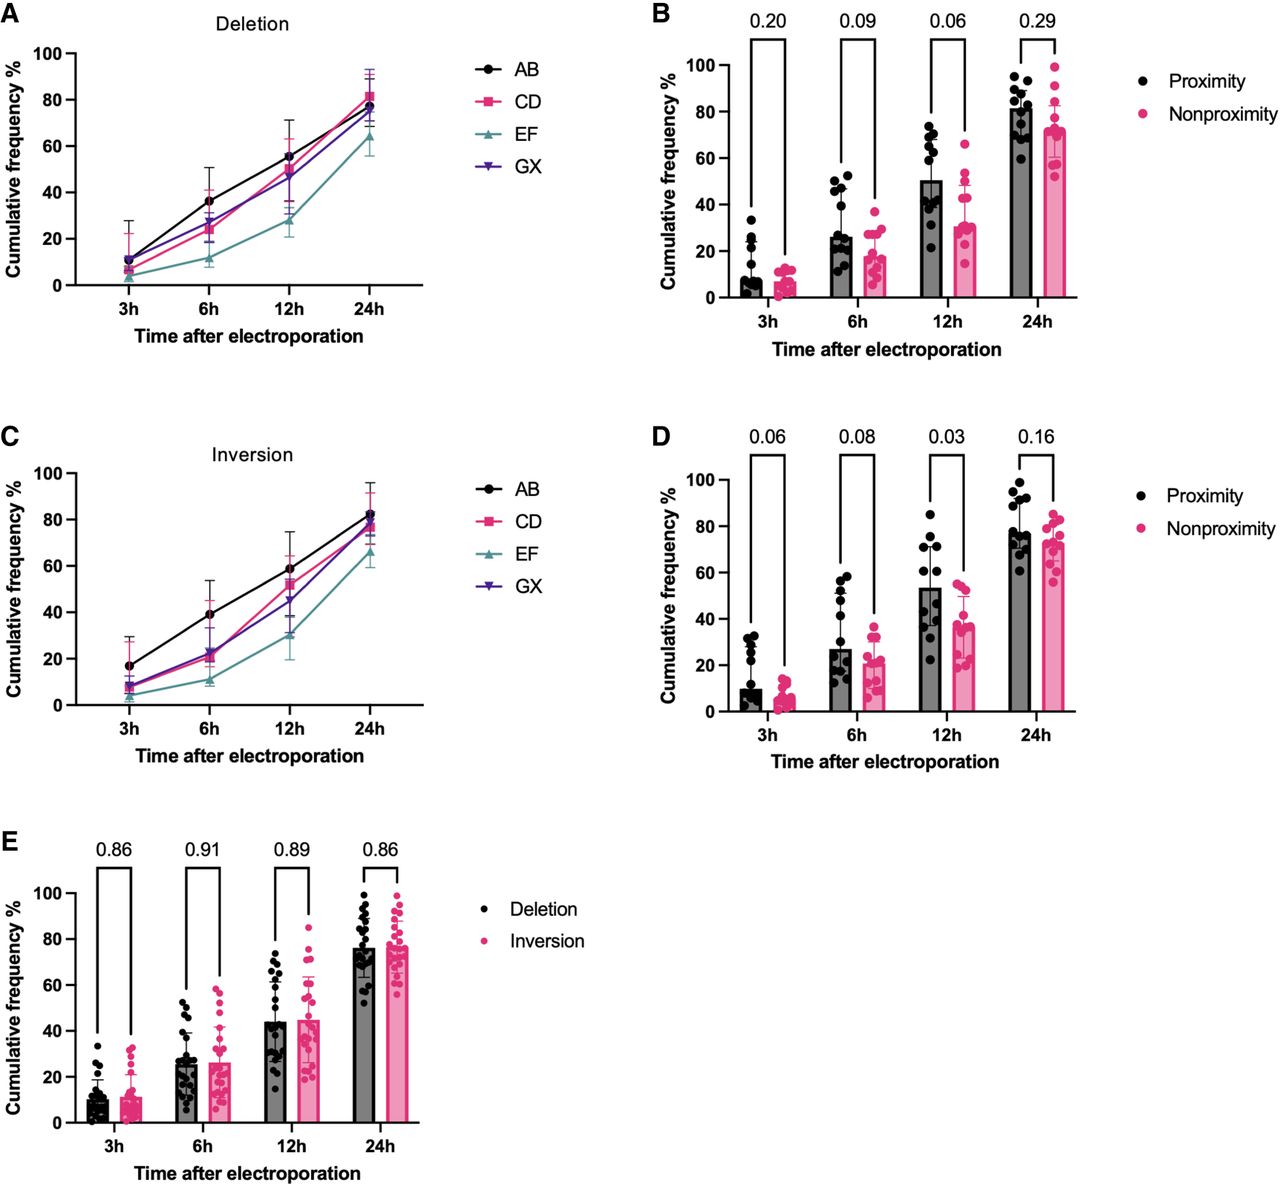
SV frequency at 3, 6, 12, and 24 h after electroporation in K562 cells and normalized to the end point SV frequency for each sgRNA pair as a measure of SV formation speed. (A) Formation speed of deletions for sgRNA pairs AB, CD, EF, and GX (n = 6 sgRNA pairs in each group; six chromosome loci with one sgRNA pair). (B) Formation speed of deletions for proximity versus nonproximity sgRNA pairs (n = 12 sgRNA pairs in each group; six chromosome loci with two sgRNA pairs); P-values from Mann–Whitney U test. (C) Formation speed of inversions for sgRNA pairs AB, CD, EF, and GX (n = 6 sgRNA pairs in each group; six chromosome loci with one sgRNA pair). (D) Formation speed of inversions for proximity versus nonproximity sgRNA pairs (n = 12 sgRNA pairs in each group; six chromosome loci with two sgRNA pairs); P-values from Mann–Whitney U test. (E) Formation speed of deletions versus inversions (n = 24 sgRNA pairs in each group; six chromosome loci with four sgRNA pairs); P-values from Wilcoxon matched-pair signed-rank test. The observations are biological replicates, and the error bars show the median and IQR.


