
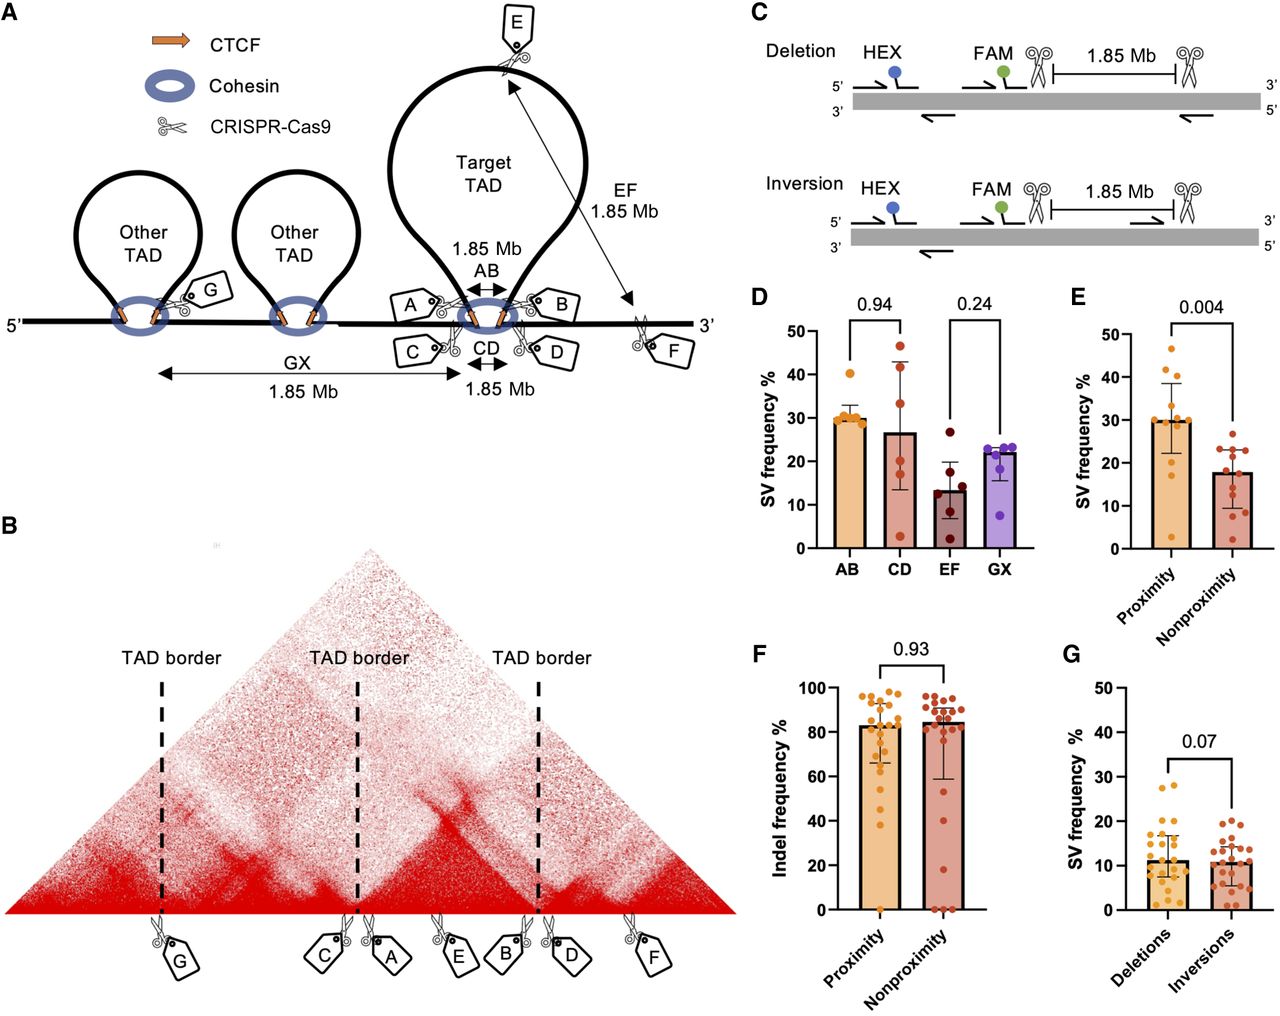
The effect of spatial proximity on SV frequency in K562 cells. (A) Six TADs were identified in K562 cells and named according to their position: Chr 2, Chr 6, Chr 10, Chr 17, Chr 21, and Chr X. Seven sgRNAs were designed for each TAD to investigate spatial proximity effects: sgRNAs A and B, which targeted sequences inside the CTCF motif at the left and right TAD border; sgRNAs C and D, which targeted sequences outside the CTCF motif at the left and right TAD border; sgRNA E, which targeted an intra-TAD sequence; sgRNA F, which targeted a sequence outside the TAD; and sgRNA G (or H, not shown), which targeted a sequence inside the CTCF motif of a neighboring TAD. Individual sgRNAs were electroporated into K562 cells in separate pairs as AB, CD, EF, and GX (X could be sgRNA A, B, or H). All pairs would have the same distance in base pairs between them, but AB and CD would be in spatial proximity, whereas EF and GX would be spatially distant. (B) An example Hi-C map of the Chr 6 TAD. (C) Illustration of the gain-of-signal ddPCR assay with primers surrounding the cut sites of the sgRNA pair and the binding site of the FAM probe. The HEX probe included to adjust for locus copy number is also illustrated. (D) SV frequencies (deletions + inversions) for AB, CD, EF, and GX sgRNA pairs (n = 6 sgRNA pairs in each group; six chromosome loci with one sgRNA pair); P-values from Mann–Whitney U test. (E) SV frequencies between proximity and nonproximity sgRNA pairs (n = 12 sgRNA pairs in each group; six chromosome loci with two sgRNA pairs); P-value from Mann–Whitney U test. (F) Individual sgRNA efficiencies measured by their ability to induce indels (n = 24 sgRNAs in each group; six chromosome loci with four sgRNAs); P-value from Mann–Whitney U test. (G) Frequencies of deletions and inversions for all sgRNA pairs (n = 24 sgRNA pairs in each group; six chromosome loci with four sgRNA pairs); P-value from Wilcoxon matched-pair signed-rank test. The observations are biological replicates, and the error bars show the median and IQR.


