
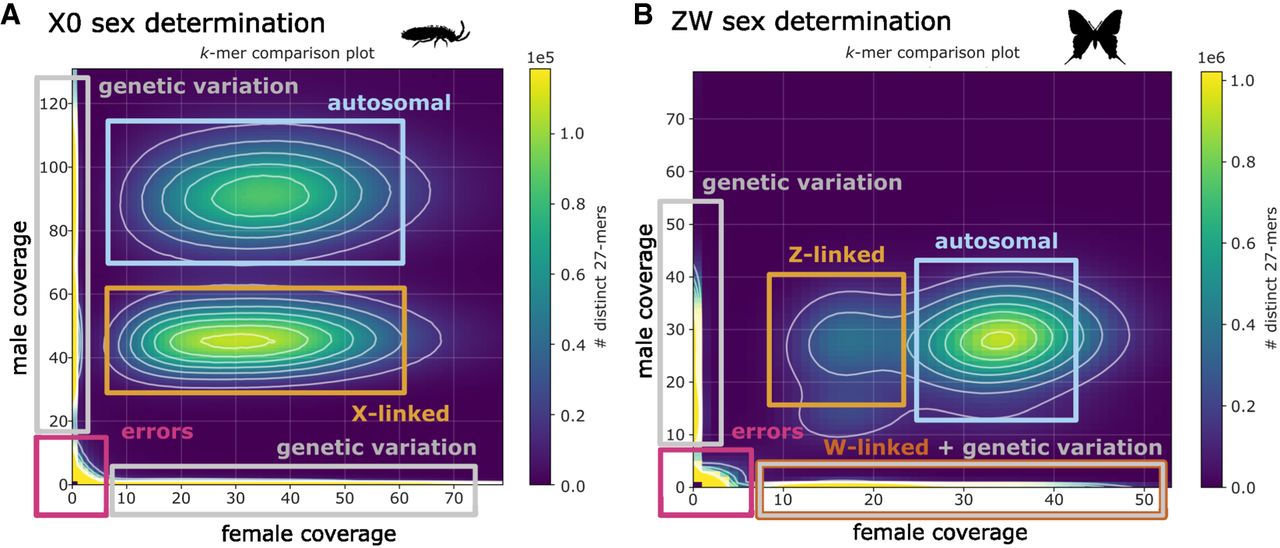
k-mer comparison of multiple sequencing libraries. Examples of two 2D k-mer spectra for species with the following: (A) A XO sex determination system (Orchesella cincta; data from Anderson et al. 2022) and (B) a ZW (female heterogametic) sex determination system (Iphiclides podalirius; data from Ebdon et al. 2024). Both plots show a heatmap of the frequency of k-mers in a female (x-axis) versus a male (y-axis). k-mers associated with autosomes or homogametic sex chromosomes (X or Z) can be differentiated in both plots (orange box) as they are at half the frequency in the heterogametic sex compared with autosomal k-mers (blue box). Similarly, heterogametic sex-chromosome (W Chromosome) k-mers can be identified in panel B as those that are absent in males but present in females (brown box). However, it is important to note that the autosomal genetic diversity of the two compared individuals may be mistaken for those belonging to sex chromosomes.


