
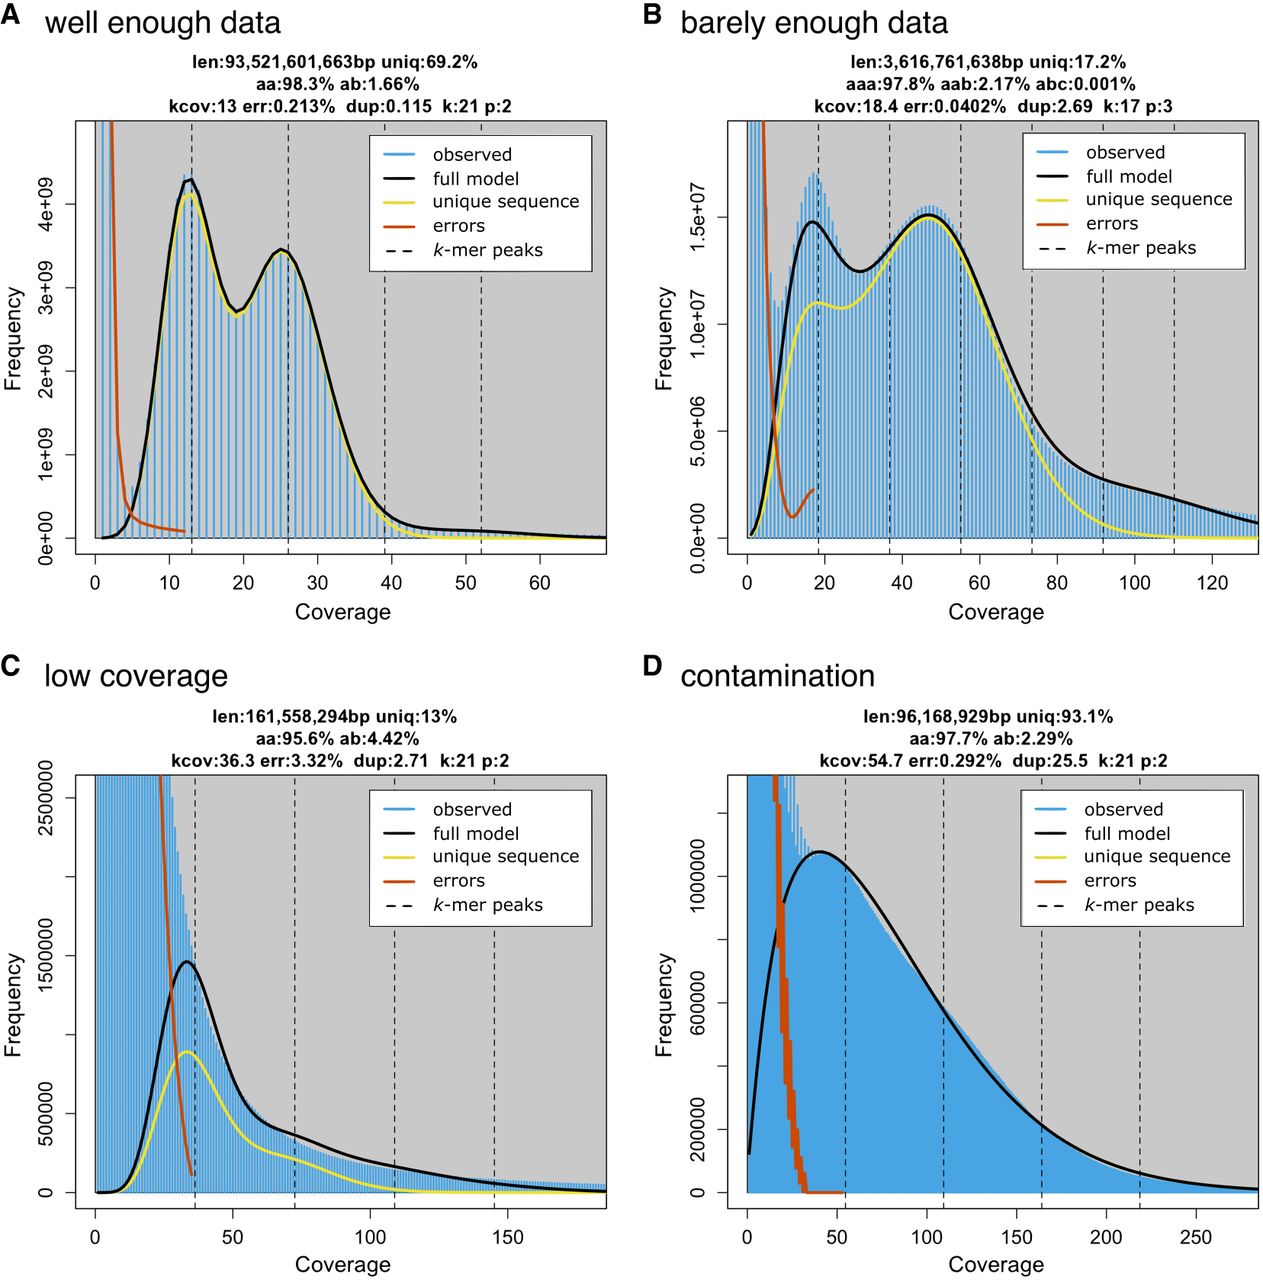
Figure 2.
Examples of k-mer spectra. (A) Viscum album: a diploid spectra with enough data to observe two distinct peaks and fit a model that accurately reflects genomic features despite the large size of the genome. (B) Procambarus virginalis: k-mer spectra of a sample with low coverage, barely sufficient for a model fit. Notably, we used k = 17 to increase the k-mer coverage and make the model fit possible. (C) Allium schoenoprasum: The sequencing coverage of this data set is approximately 1×. Error k-mers and genome k-mers are completely blended; as a consequence, the model did not converge to meaningful estimates. (D) Hypsibius dujardini: a heavily contaminated sample of a tardigrade.


