
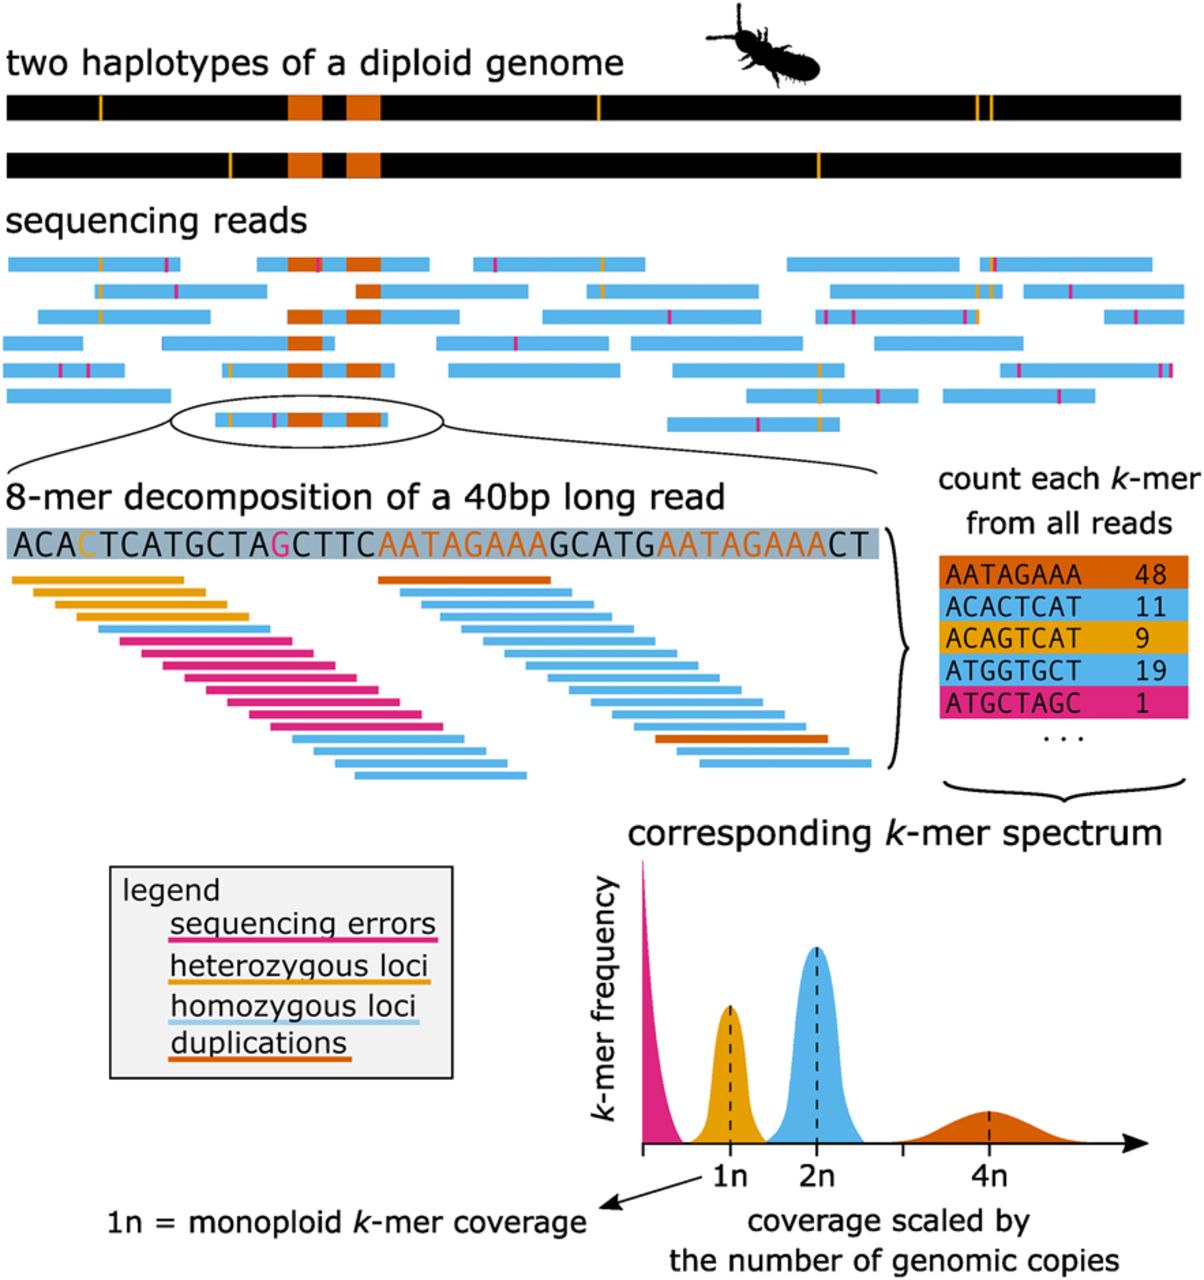
From sequencing reads to k-mer spectrum. This figure shows a basic illustrative example of how genomic reads can be translated into a number of k-mers that can be counted and represented by a k-mer spectrum: The example diploid genome (two haplotypes) has one duplication (orange) and six heterozygous loci (yellow). The sequencing reads contain the corresponding genomic sequence but also sequencing errors (pink). Example of a 40-base long read decomposed to k-mers (8-mer). Finally, k-mer spectra represent how many different k-mers (y-axis) show a specific coverage (x-axis) in the whole sequencing data set. In the vast majority of real genomic data sets, the peaks in the k-mer spectra would overlap, and furthermore, there would be a small number of k-mers representing other ploidies too (e.g., 3n for heterozygous duplications, or higher ploidies for more repetitive regions).


