
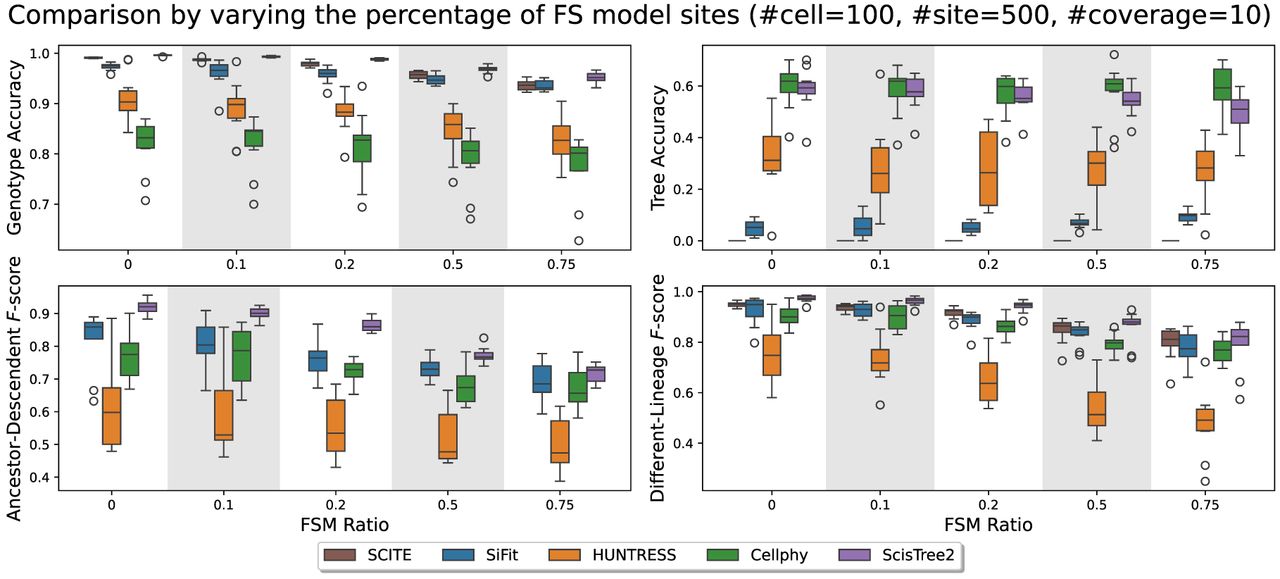
Figure 8.
Comparison of simulated data with varying proportions of the FS model sites from 0 to 0.75. The data set consists of 100 cells and 500 sites, with other parameters set to default. Note that AD and DL F-scores are calculated for sites that fit the IS model only.


