
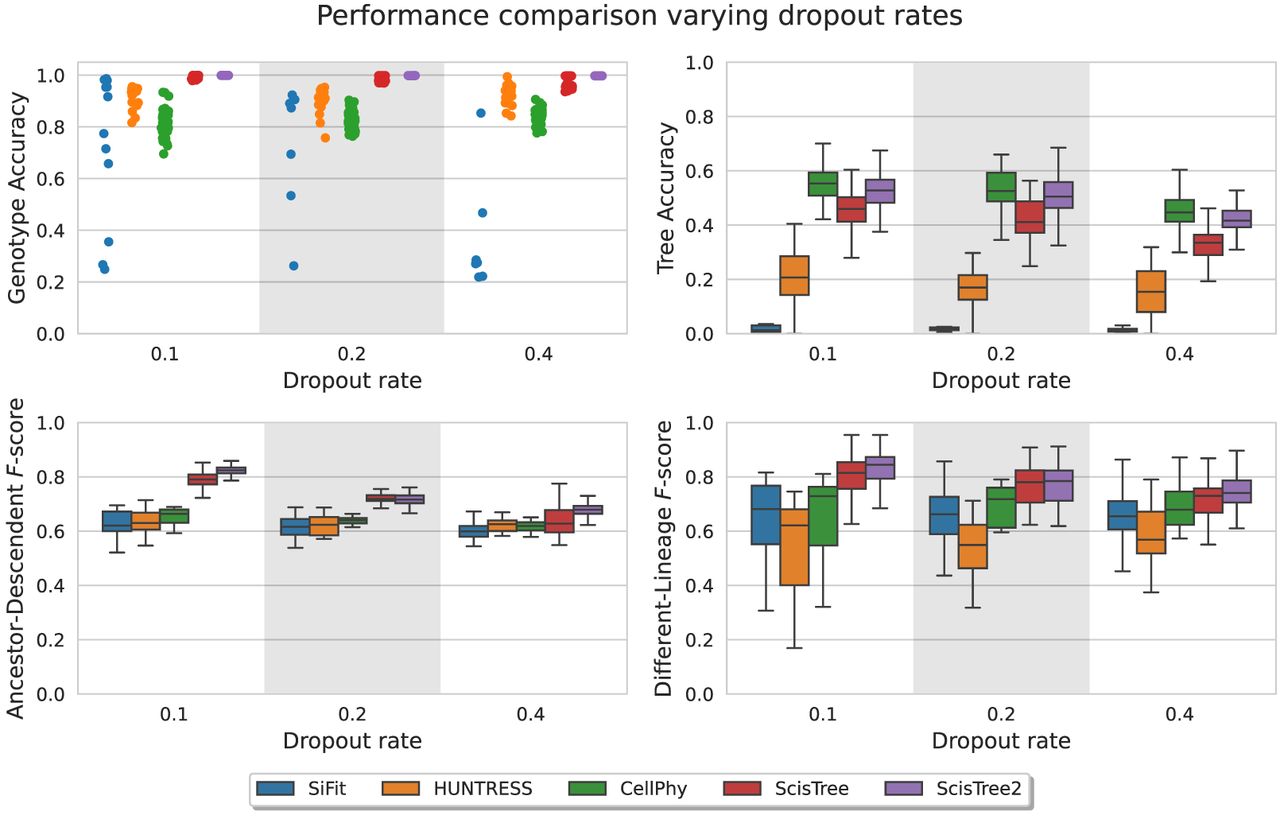
Figure 4.
Performance comparison for ScisTree2 and four other methods on various dropout rates. x-axis: dropout rates at 0.1, 0.2, and 0.4. y-axis: performance metric.
(Downloading may take up to 30 seconds. If the slide opens in your browser, select File -> Save As to save it.)
Click on image to view larger version.
Performance comparison for ScisTree2 and four other methods on various dropout rates. x-axis: dropout rates at 0.1, 0.2, and 0.4. y-axis: performance metric.
 CiteULike
 Delicious
 Digg
Digg Facebook
 Google+
 Reddit
 Twitter
