
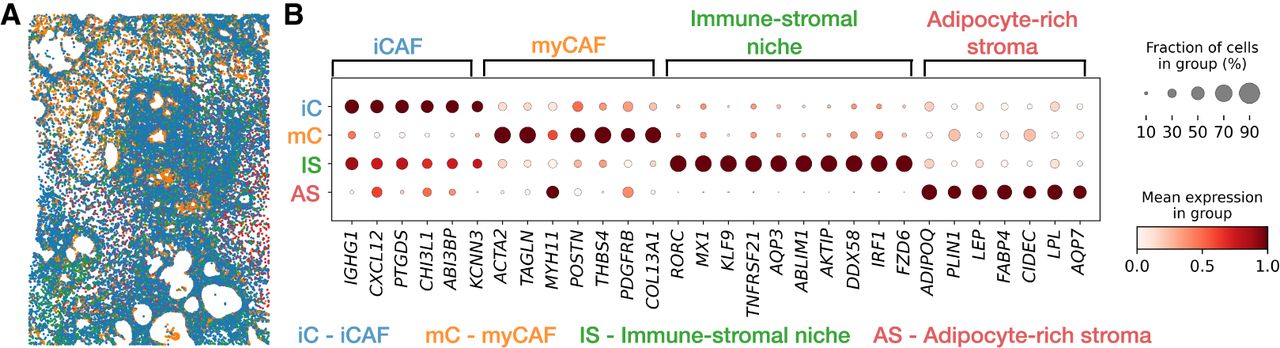
Figure 5.
Stromal cell subtype analysis. (A) Spatial distribution of stromal cells in Xenium data with four annotated cell subtypes. (B) Marker gene expression for the annotated cell subtypes within the stromal cell type in Xenium data.


