
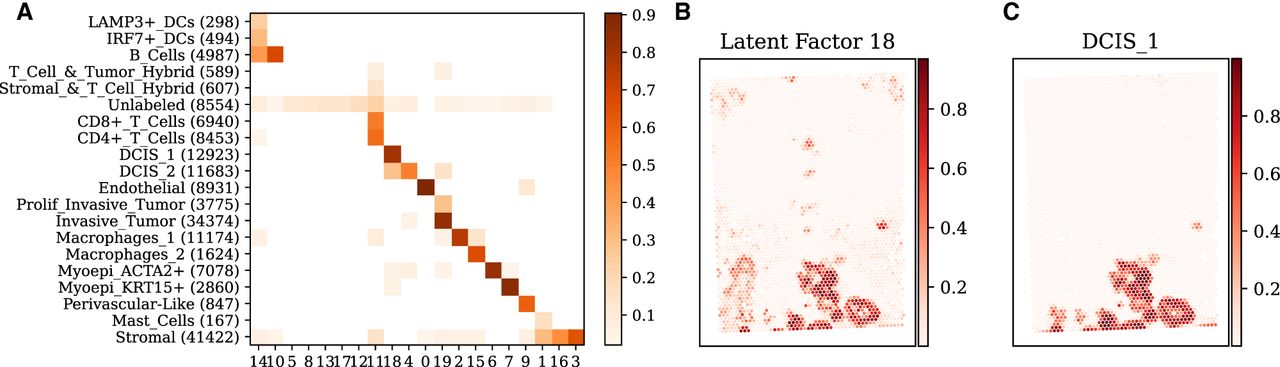
Figure 4.
Analysis of SIID deconvolution on breast cancer (BRCA) data. (A) Comparison of the clustering of Xenium cells obtained by SIID on the BRCA data set with the cell type annotation provided by 10x Genomics. Each row corresponds to an annotated cell type, with the number of Xenium cells belonging to that type in parentheses. Each column corresponds to a latent factor derived by SIID. Intensity of each grid point is the cosine similarity between the assignments, with similarity scores below 0.02 excluded for visual clarity. (B) Spatial distribution of a latent factor inferred by SIID. (C) Spatial distribution of deconvolved DCIS_1 cell type from RCTD.


