
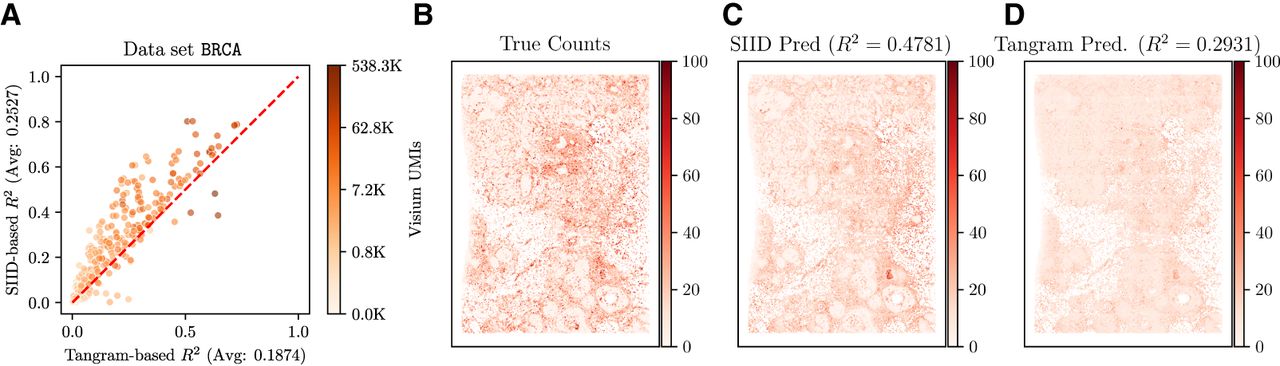
Analysis of SIID imputation on breast cancer (BRCA) data. (A) Comparison of holdout R2 score of SIID (y-axis, correlation score averaged over five runs) and Tangram in cell mode (x-axis) for each gene in the Xenium panel for the BRCA data set. Each point on the plot corresponds to a single gene, whose color corresponds to the number of Visium UMIs mapped to the gene on a log-scale. Genes above the red y = x line have higher imputation performance for SIID compared to Tangram. (B) Expression of gene ZEB2 in Xenium (ground truth for evaluating imputation), (C) SIID prediction of ZEB2 expression when the gene is held out (R2 = 0.4781 against the ground truth). (D) Tangram prediction of ZEB2 expression (R2 = 0.2931 against ground truth). Total counts of each gene over all cells are normalized to 1,000,000, and normalized counts are shown on the same color scale in B, C, and D.


