
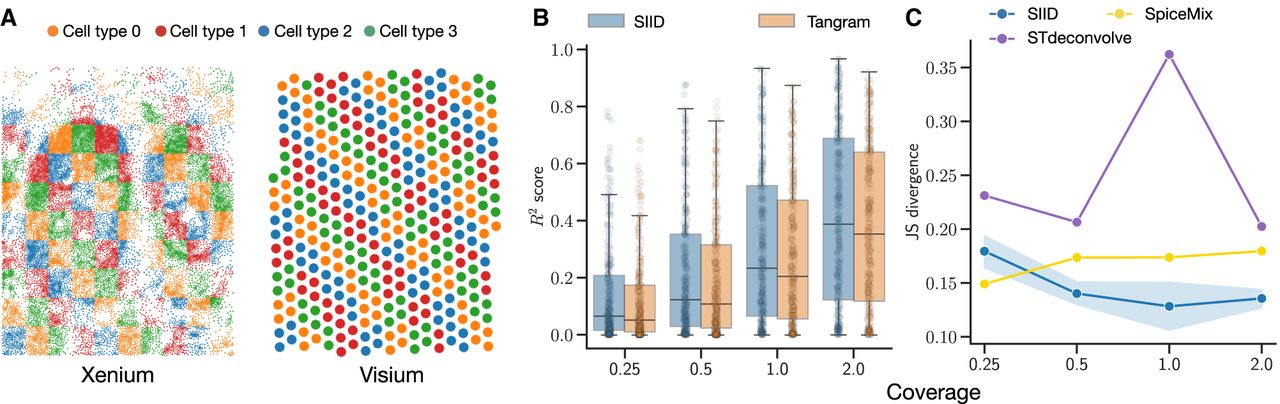
Figure 2.
Evaluating SIID on simulated data. (A) A simulated Xenium and corresponding Visium data set with gene expression of cell types obtained from a matching scRNA-seq data set (Janesick et al. 2023). (B) R2 of imputed gene expression for holdout genes from SIID and Tangram stratified by coverage. (C) Average Jensen-Shannon (JS) divergence between ground truth and predicted cell type mixture proportions predicted by SIID, STdeconvolve, and SpiceMix for simulated Visium data over all spots stratified by coverage.


