
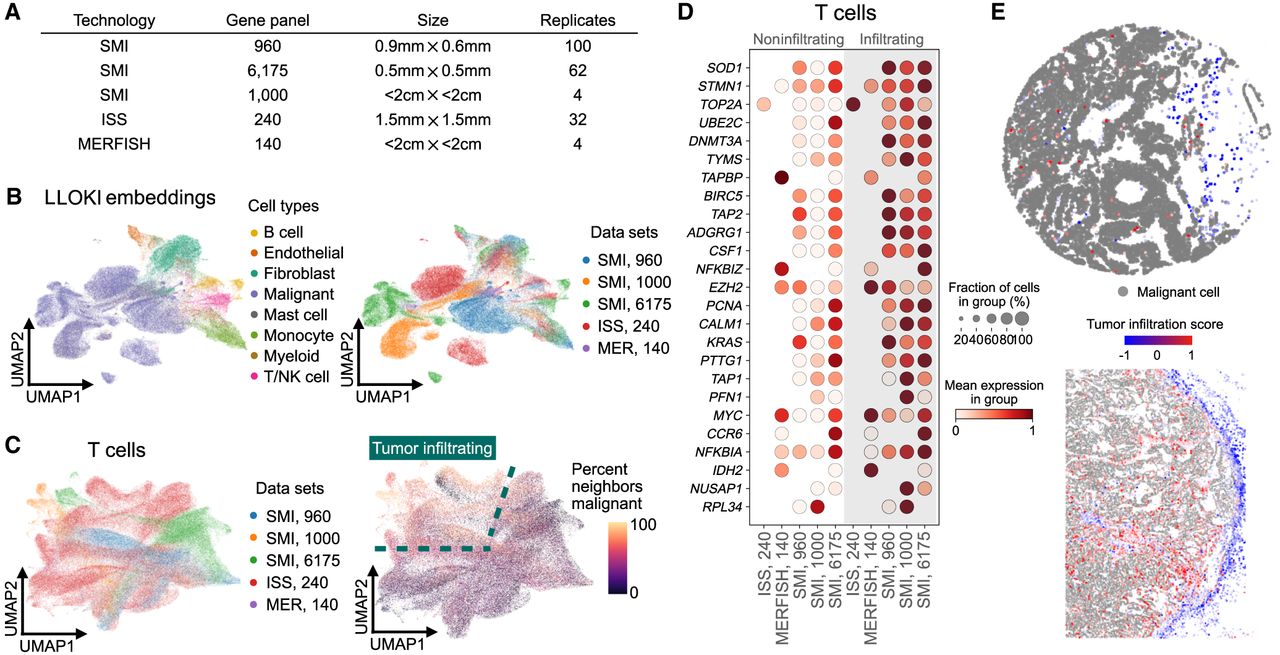
LLOKI identifies cross-technology gene program indicative of tumor infiltration in T cells in ovarian cancer. (A) Summary of the five ovarian cancer ST data sets used in this analysis. (B) UMAP visualization of LLOKI embeddings shows successful integration of nonmalignant cells across data sets, whereas transcriptionally distinct tumor cells remain separate. (C) UMAP visualization of LLOKI embeddings of T cells, colored by data set (left) or by the proportion of 100-nearest spatial neighbors that are malignant (right). Dashed outlines indicate regions identified as tumor-infiltrating. (D) Expression levels of upregulated genes from the cross-technology tumor infiltration gene program in infiltrating versus noninfiltrating T cells. Missing dots indicate genes that were not measured in particular data sets. (E) Representative in situ visualization showing T cells colored by the tumor infiltration score and malignant cells in gray.


