
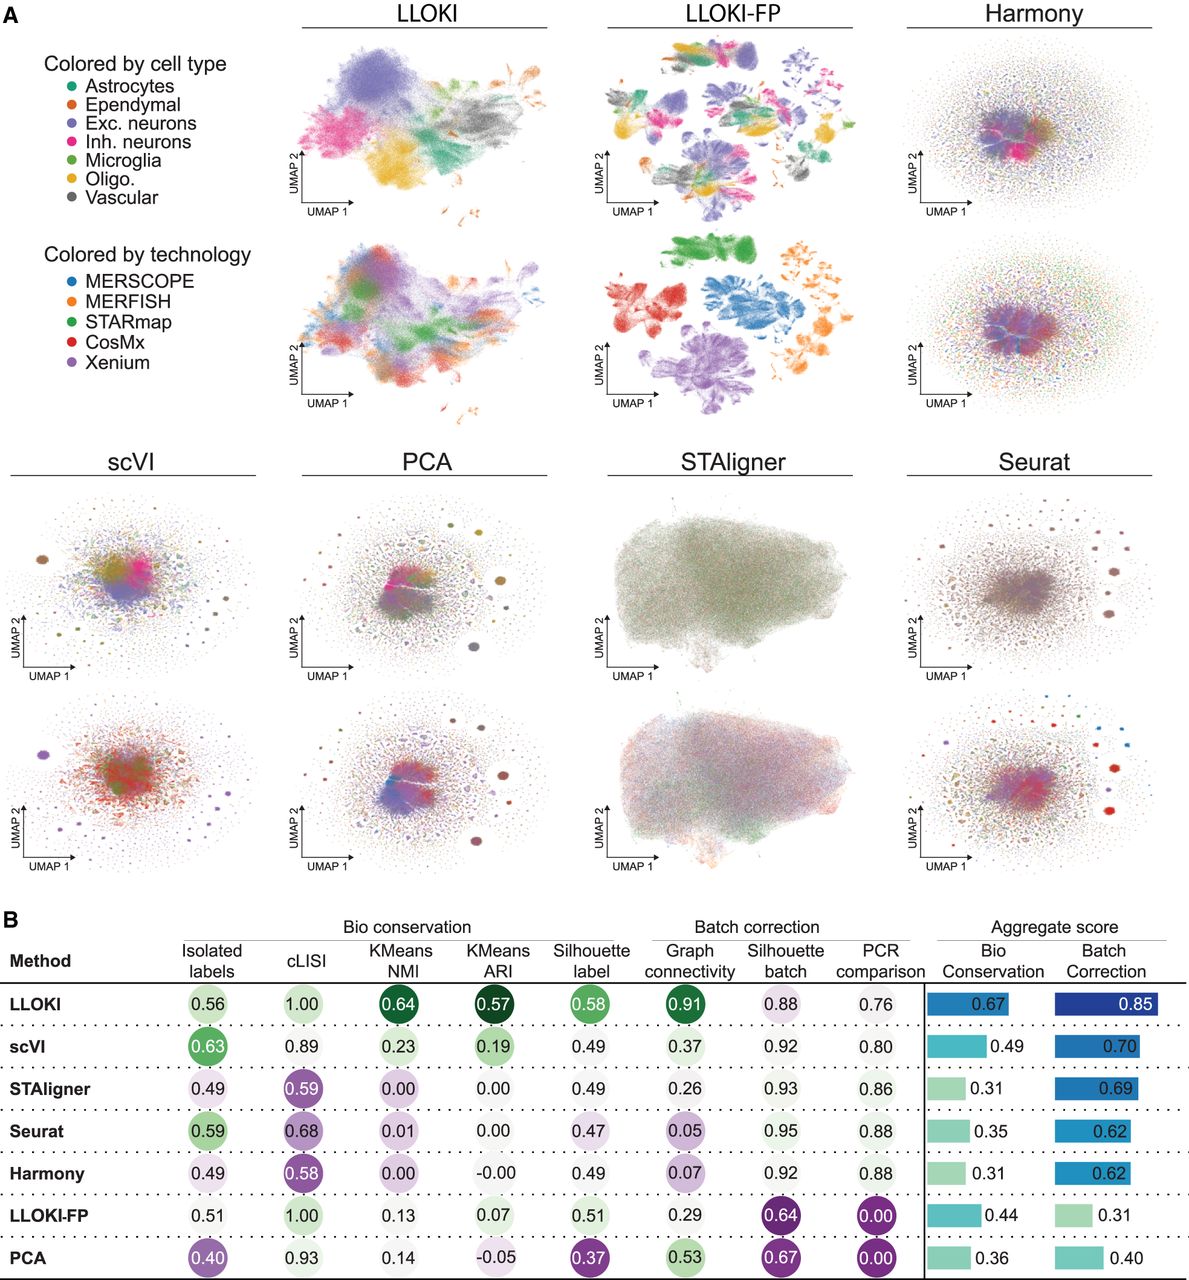
Figure 2.
Comparative analysis of batch integration using LLOKI versus six baseline methods across slices from five spatial transcriptomics technologies. (A) UMAP visualizations of integrated data, colored by cell type (top) and by technology (bottom), showing the degree of batch separation and preservation of biological variation. (B) Quantitative performance evaluation of all methods across eight metrics, measuring both biological variation preservation and batch correction across technologies.


