
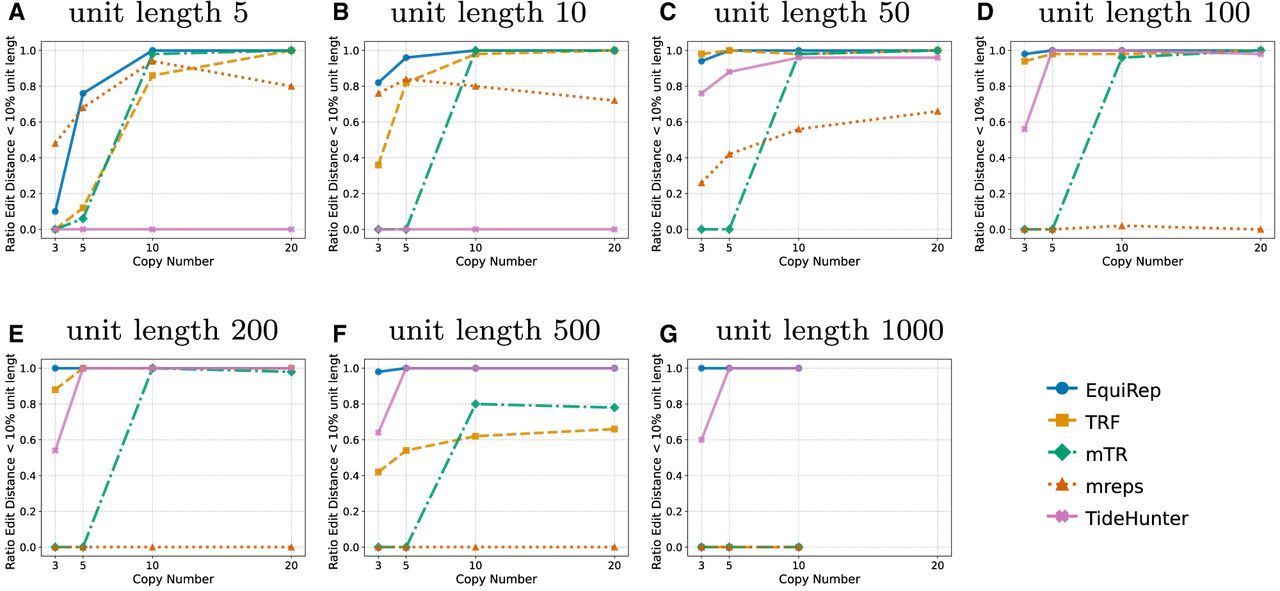
Figure 2.
Comparison of proportion of close predictions (rotation-aware edits <10% of the unit length) on simulated data at a 10% error rate, for (A–G) unit lengths 5, 10, 50, 100, 200, 500, and 1000, respectively.
(Downloading may take up to 30 seconds. If the slide opens in your browser, select File -> Save As to save it.)
Click on image to view larger version.
Comparison of proportion of close predictions (rotation-aware edits <10% of the unit length) on simulated data at a 10% error rate, for (A–G) unit lengths 5, 10, 50, 100, 200, 500, and 1000, respectively.
 CiteULike
 Delicious
 Digg
Digg Facebook
 Google+
 Reddit
 Twitter
