
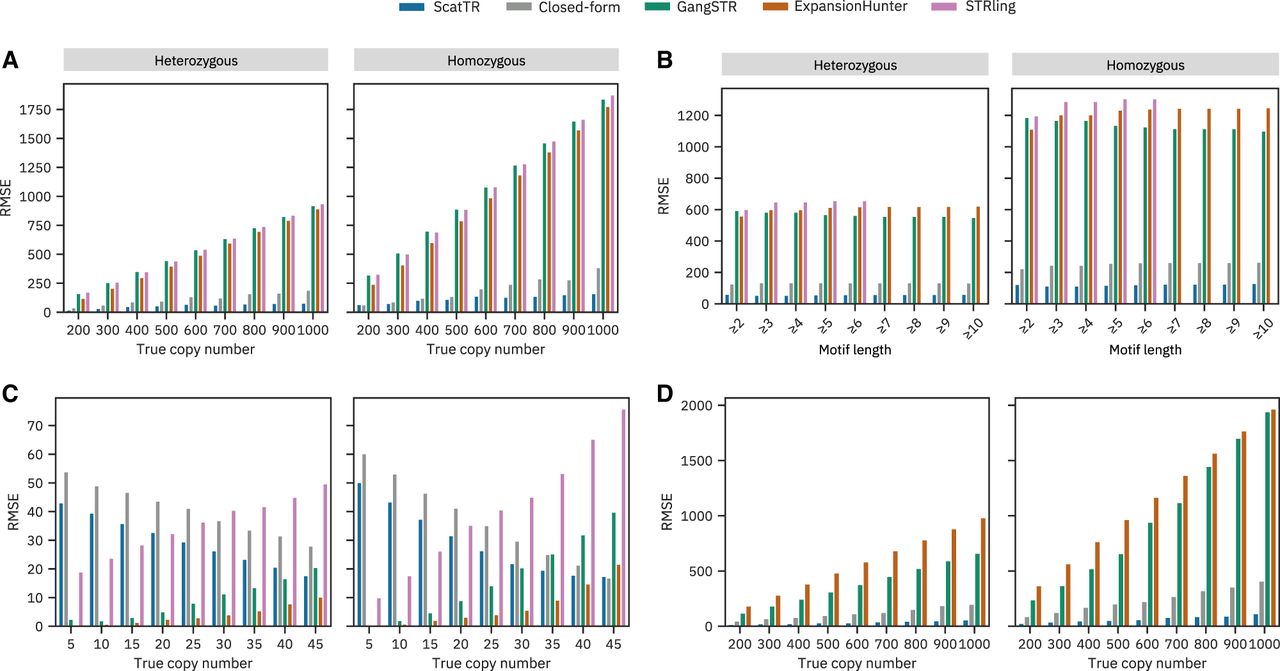
Benchmarking accuracy against the state-of-art with simulated data. We estimated the TR copy number using state-of-the-art methods (ExpansionHunter, GangSTR, and STRling), ScatTR, and a closed-form solution and calculated the root mean square error (RMSE) between the predicted and the true copy number of TRs on simulated data. (A) RMSE across samples compared with true copy numbers for large TRs with motif lengths between 2 and 20 bp. Heterozygous expansions on the left and homozygous on the right. These estimates were conducted on 540 simulated short-read WGS samples representing 30 TR loci and a range of known copy numbers (200–1000). (B) RMSE as a function of TR motif length for A. (C) RMSE across samples compared with true copy number of small TRs with motif lengths between 2 and 20 bp. Heterozygous expansions on the left and homozygous on the right. These estimates were conducted on 540 simulated short-read WGS samples representing 30 TR loci and a range of known copy numbers (five to 45). (D) RMSE across samples compared with true copy numbers for large TRs with motif lengths between 21 and 50 bp. These estimates were conducted on 540 simulated WGS samples with TR expansions, representing 30 TR loci and a range of known copy numbers (200–1000).


